VMware Explorer Primary view
The VMware Explorer dashboard has a Primary view that takes up the entire display area of the Foglight for VMware browser interface. For more information about the VMware Explorer dashboard, see Investigating performance metrics .
The VMware Explorer Primary view is the most content-intensive view in Foglight for VMware. It provides access to summary (of alarm, resource, and other) information for the object being viewed in the VMware Explorer dashboard, as well as detailed information on performance with respect to the four core ESX infrastructure resources: CPU, memory, disk, and network usage. This view provides a great deal of value to administrators who leverage Foglight for VMware to monitor their virtual infrastructure.
It provides navigation tabs that can be used to view a variety of valuable information pertaining to the object being viewed.
The metrics and the amount of detail displayed in the Primary view vary depending on the type of object you select.
The Primary view changes in appearance and content, depending on which navigation tab and embedded view you have selected.
The VMware Explorer Primary view heading, located at the top of the VMware Explorer Primary view, consists of three main components: an icon and text that specify the type of selected object or object container (from this point on, these two are referred to simply as object, unless otherwise specified), an alarm summary for the selected object, and navigation tabs.
The alarm summary at the right of the Primary view heading shows you the number of alarms at each severity level that are outstanding for the selected object. When you click an alarm count, you get a popup that lists the active alarms for the object.
The navigation tabs are located immediately below the selected object’s name. These navigation tabs vary from object to object, but generally contain a tab to an object summary (typically the default view), a tab to an object performance overview, and one or more tabs to other relevant information.
The Primary view changes in appearance and content, depending on which navigation tab and embedded view you have selected. For example, if you select an object type container from the Topology view, the Summary tab in the Primary view displays a consumption graph and a table that are representative of the group of objects within that container. However, if you select a Resource Pools container from the Topology view, the Summary tab in the Primary view displays a Resource Pools Relationship Tree that contains every resource pool that belongs to the clusters within the associated VirtualCenter.
If you select an individual resource pool from the Virtual Infrastructure view, the Summary tab in the Primary view displays summary and utilization information for that resource pool. This is typically the type of information you see for the Summary tab when you select any individual object from the Virtual Infrastructure view.
The metrics and the amount of detail displayed in the Primary view vary depending on the type of object you select.
The VMware Explorer Primary view contains a combination of a number of different embedded views. For more information, see the following topics:
VMs tab
The VMware Explorer’s VMs tab displays the combined CPU utilization for all virtual machines associated with the selected component. This includes the percentages of CPU processing power allocated to the virtual machines that is used and ready for use.
This view is made up of the following embedded views:
VMware Modeler views
The VMware Modeler dashboard contains the following view:
Migration Modeler view
The Migration Modeler view uses the collected data to show the effect that a virtual machine may have on an ESX host during a selected time period. This view can be used to predict potential performance impacts of moving virtual machines to specific physical ESX hosts.
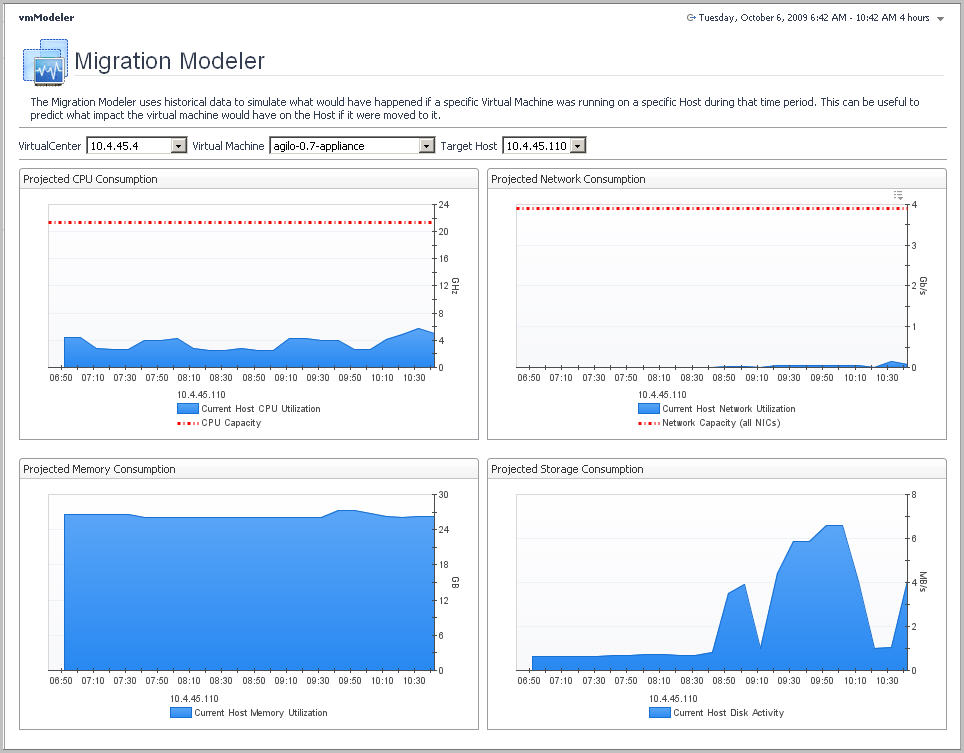
This view appears on the VMware Modeler dashboard.
This view is made up of the following embedded views:
