Foglight Resource Optimizer for Hyper-V Environments
With virtual machines quickly becoming the industry standard in an IT infrastructures, making it necessary to plan for the addition of virtual machines to the physical hosts. This is often a challenge for administrators. Foglight Evolve Cloud® Resource Optimizer simplifies the optimization process, providing waste-finding and right-sizing functionality for virtualized environments.
Resource Optimizer for Hyper-V Environments
Performance investigation with the Hyper-V Explorer
The Hyper-V Explorer provides a great deal of value to administrators who leverage Hyper-V Monitoring in Foglight® Evolve Cloud to monitor their virtual infrastructure. It has a hierarchical interface that displays various performance metrics and alarms within the virtual infrastructure. It provides several informative views through which you can quickly and easily access detailed information about any of the available components (physical or virtual) within the monitored environment.
About the Hyper-V Explorer
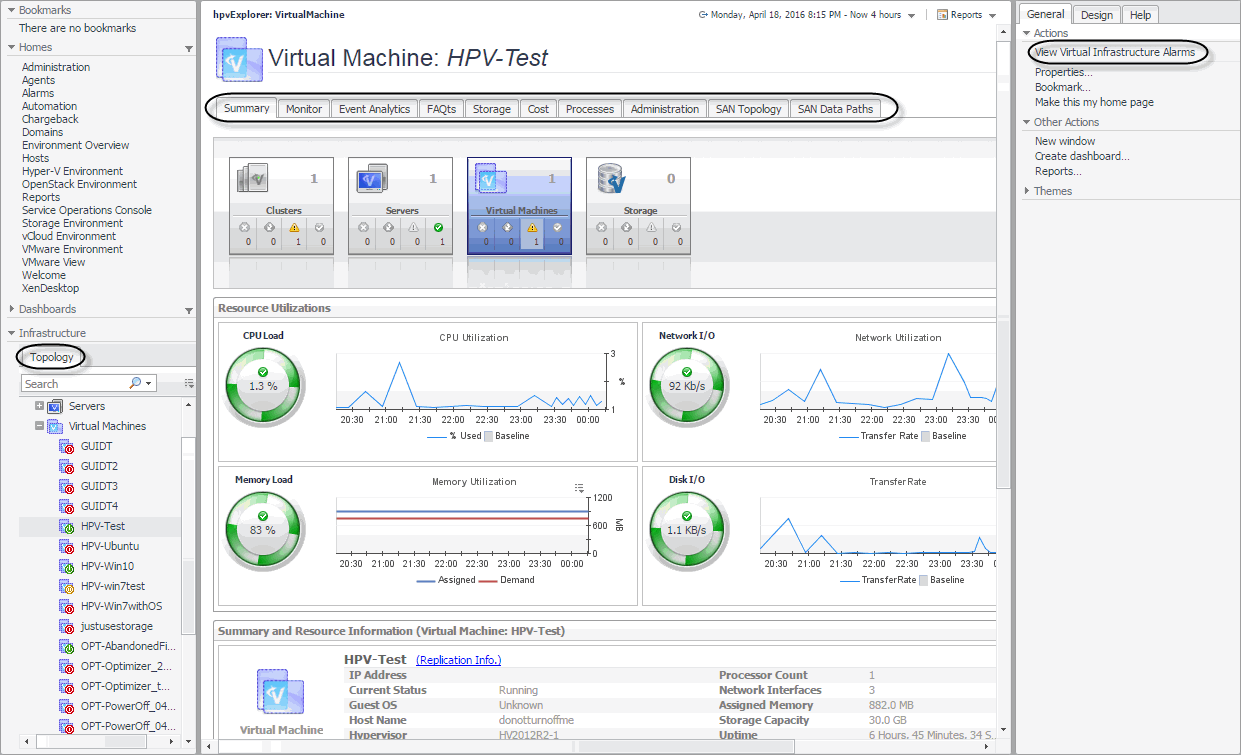
The Hyper-V Explorer provides detailed performance metrics about an object or a group of objects selected on the Hyper-V Explorer Topology tab.The upper part of the Hyper-V Explorer consists of three main components: a selected tile, an alarm summary for the selected object, and navigation tabs.
Accessing the Hyper-V Explorer
The Hyper-V Explorer provides detailed performance metrics about an object or a group of objects selected on the Hyper-V Explorer Topology tab.
|
3 |


