지금 지원 담당자와 채팅
지원 담당자와 채팅

Foglight 5.9.5 - Getting Started Guide

Components

Quest Software Inc.’s Foglight® solution simplifies application performance monitoring and reduces the skills and effort required to manage applications, the user experience, and the supporting infrastructure.

Unlike other solutions, Foglight uses a single code base, and has a model-driven design that couples fast deployment and accelerated time-to-value. It offers the modular flexibility required to deliver a range of capabilities and sophistication to meet the needs of any organization, from those still focused on technology-centric monitoring to those that have completed the transition to application-centric or transactional monitoring.

Foglight performs equally well in physical, virtual, and mixed infrastructure environments, providing visibility into issues affecting the application and end-user experience. Intuitive workflows help you quickly move from the symptom to the root cause in the application, database, infrastructure, or network to resolve issues, reducing mean time to resolution. Predefined and drag-and-drop dashboards provide insight that is tailored to each stakeholder. By offering comprehensive visibility into your monitored environment, Foglight helps ensure that cross-functional teams collaborate on and prioritize issues that matter most to the business.

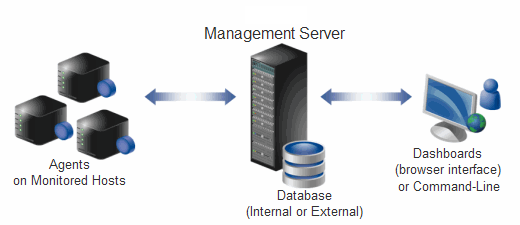
Foglight comprises several different components, which are described individually. You will be installing and using these components as you perform the steps in the installation and setup process and get started using Foglight.

Foglight Management Server

Foglight Management Server is the central component of Foglight. The Management Server receives information from agents, stores and processes data, and makes it available in the browser interface.

The Foglight database stores all system, application, and performance data. Over time, it becomes an invaluable source of historical information for planning future system capacity requirements and for doing point-in-time analysis.

Foglight browser interface

Foglight has a browser interface that displays data collected from your monitored environment. It allows you to view this data in various formats and levels of detail.

The browser interface consists of three areas:

See the User Guide and the Administration and Configuration Guide for more information.

Customizable dashboards

Foglight also includes the Web Component Framework (WCF), which allows you to create and populate your own custom interface views on top of the dynamic data schemas generated by the Management Server. See the Web Component Guide and the Web Component Tutorial for more information.

셀프 서비스 도구
지식 기반
공지 및 알림
제품 지원
소프트웨어 다운로드
기술 설명서
사용자 포럼
비디오 자습서
RSS 피드
문의처
라이센싱 지원가져오기
기술 지원
모두 보기
관련 문서

The document was helpful.

평가 결과 선택

I easily found the information I needed.

평가 결과 선택