지금 지원 담당자와 채팅
지원 담당자와 채팅

Foglight for Hyper-V 5.8 - User and Reference Guide

About Foglight for Hyper-V Agent administration Performance monitoring with the Hyper-V Environment dashboard Performance investigation with the Hyper-V Explorer Foglight for Hyper-V alarms Appendix: Hyper-V Agent error codes

Performance investigation with the Hyper-V Explorer

The Hyper-V Explorer provides a great deal of value to administrators who leverage Foglight® for Hyper-V to monitor their virtual infrastructure. It has a hierarchical interface that displays various performance metrics and alarms within the virtual infrastructure. It provides several informative views through which you can quickly and easily access detailed information about any of the available components (physical or virtual) within the monitored environment.

About the Hyper-V Explorer

The Hyper-V Explorer provides detailed performance metrics about an object or a group of objects selected on the Hyper-V Explorer Topology tab.The upper part of the Hyper-V Explorer consists of three main components: a selected tile, an alarm summary for the selected object, and navigation tabs.

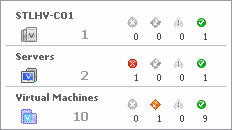
The alarm summary in the top right shows the number of alarms at each severity level that are outstanding for the selected object type: clusters, servers, and virtual machines. Clicking an alarm count shows a list of the active alarms for the selected object or group of objects.

The range of navigation tabs varies from object to object, but generally includes a tab that displays the selected object’s summary (typically the default view), a tab displaying the selected object’s performance monitoring details, and one or more tabs with other relevant information. There are tabs that appear in the display area and a tab displaying a topology tree on the navigation panel. In addition, the action panel also provides instant access to a number of useful actions and tasks.

Figure 148. Hyper-V Explorer

Accessing the Hyper-V Explorer

The Hyper-V Explorer provides detailed performance metrics about an object or a group of objects selected on the Hyper-V Explorer Topology tab.

Figure 149. Hyper-V Explorer

3
On the navigation panel, under Dashboards, click Hyper-V > Hyper-V Explorer.
Figure 150. Hyper-V Explorer

About the Hyper-V Explorer topology

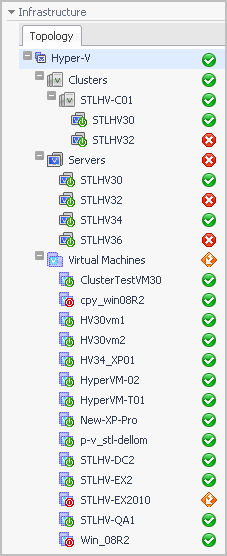
The Topology tab appears on the navigation panel when you access the Hyper-V Explorer. It displays a tree showing a hierarchical structure of the elements in your virtual infrastructure.

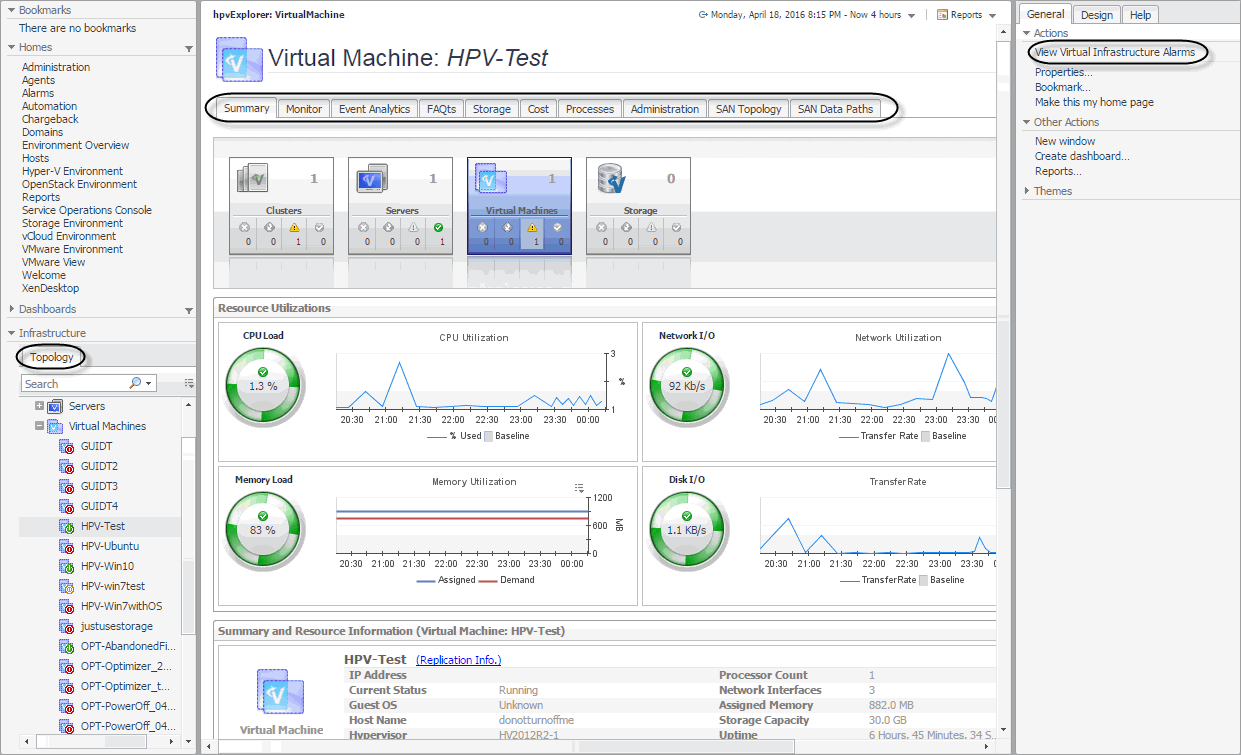
Figure 151. Topology tab

Use it to quickly select an object or object container and view the related information in the display area. Hovering over a specific node in this tree shows a dwell that gives you more information about that component, the related elements, and their alarm status. For example, hovering over a cluster node shows the name, the number of servers in that cluster, and the number of virtual machines running on the servers that belong to that cluster. It also shows the alarm counts for each component type and alarm severity.

관련 문서

The document was helpful.

평가 결과 선택

I easily found the information I needed.

평가 결과 선택