지금 지원 담당자와 채팅
지원 담당자와 채팅

Foglight for Hyper-V 5.8 - User and Reference Guide

About Foglight for Hyper-V Agent administration Performance monitoring with the Hyper-V Environment dashboard Performance investigation with the Hyper-V Explorer Foglight for Hyper-V alarms Appendix: Hyper-V Agent error codes

SOFS Servers view

The SOFS Servers view is a tree view. It lists the SOFS servers that exist in your environment and shows their state.

This view appears in the Quick-View on the left when you select the SOFS Servers tile in the Virtual Environment view.
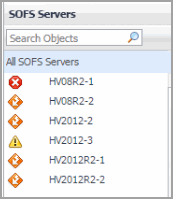
Selecting the All SOFS Servers node displays overall resource utilization for all servers in your integrated system, and the elements that consume the highest amount of system resources in the Summary - All Servers view on the right. Similarly, selecting an SOFS server node shows server-specific metrics in the Server Summary view.

Alarm severity. The state of the most recent alarm raised against the associated server.
All SOFS Servers. A parent node for the server object instances that appear in this view.
Server. The SOFS server name.

Drill down on:

Summary - All SOFS Servers view

The Summary - All SOFS Servers view displays overall resource utilization information for a group of SOFS servers and shows the elements that consume the highest amount of system resources.

This view appears in the Quick-View on the left when you select All SOFS Servers in the SOFS Servers view.
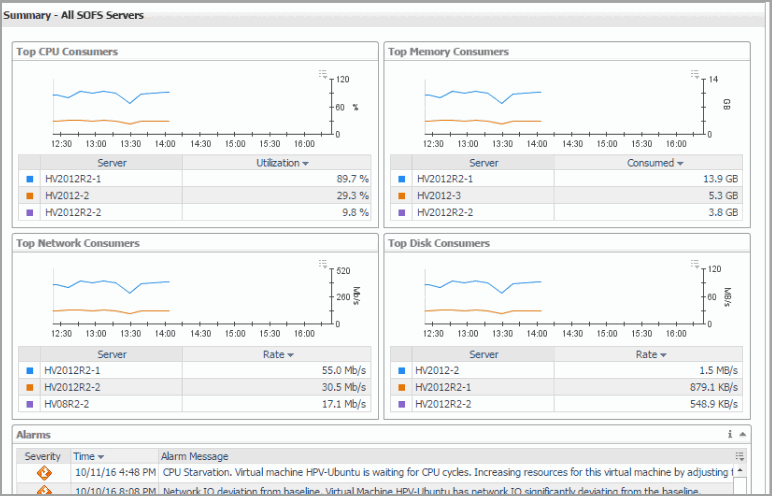
This view is made up of the following embedded views:

Table 31. Alarms

Lists the alarms generated against the monitored system.

Alarm Message. An explanation about why the alarm occurred.
Severity. Indicates the alarm severity: Warning, Critical, or Fatal.
Time. The time at which the alarm was generated.

Drill down on:

Severity. Displays the Alarm dialog box, showing additional information about the alarm. For more information about alarms in Foglight, see the Foglight User Help.
Figure 57. Alarm dialog box
Time. Links to the Server Summary view.

Shows the top three servers with the highest average CPU utilization.

Servers. The name of the server.
CPU Utilization.The total percentage of CPU utilization the top three CPU consumers spend on executing system code and user programs, during the selected time range.

Drill down on:

CPU Utilization (in the graph). Displays the Top Servers-CPU Utilization dialog box.
Figure 58. Top Servers - CPU Utilization dialog box

Shows the top three servers with the lowest available disk space.

Disk Transfer Rate. The rate at which the top three disk consumers read or write data to the disk during the selected time range.
Servers. The name of the server.

Drill down on:

Disk Transfer Rate (in the graph). Displays the Top Servers - Disk Transfer Rate dialog box.

Shows the top three servers with the highest average memory utilization.

Memory Consumed. The amount of memory the top three memory consumers use during the selected time range.
Servers. The name of the server that are the top three memory consumers.

Drill down on:

Memory Consumed. Displays the Top Servers - Memory Consumed dialog box.

Shows the top three servers that are consuming most network bandwidth.

Network Transfer Rate. The rate at which the top three network consumers transfer data to or from the network during the selected time range.
Servers. The name of the server that are the top three network consumers.

Drill down on:

Network Transfer Rate. Displays the Top Servers - Network Transfer Rate dialog box.

SOFS Server Summary view

The SOFS Server Summary view shows the overall resource utilization and the amounts of system resource consumption for an SOFS server.

This view appears in the Quick-View on the left when you select an SOFS server in the SOFS Servers view.
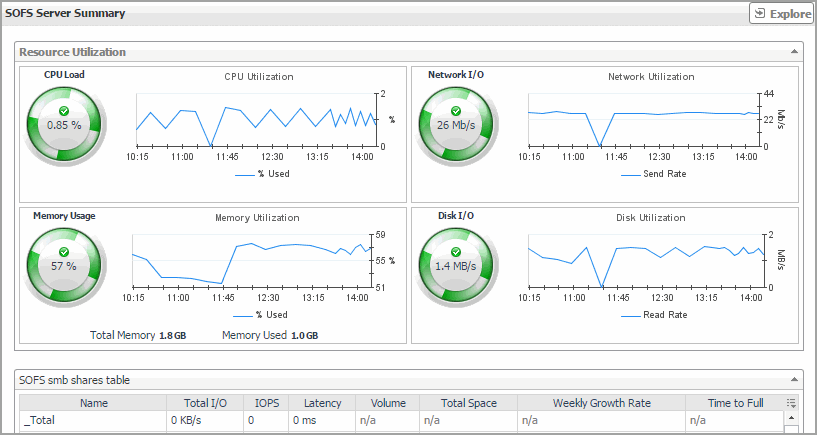
Figure 62. Server Summary view

This view is made up of the following embedded views:

Shows the resource consumption for the selected SOFS server broken down into four simple views.

CPU Load. The current percentage of the selected server’s CPU load, used to execute system code and user programs, based on the total CPU capacity.
CPU Utilization, % Used. The percentage of the server’s CPU utilization spent on executing system code and user programs during the selected time period.
CPU Utilization, Baseline. An envelope indicating the expected CPU utilization range based on historical data.
Disk I/O. The current disk I/O rate for the selected server.
Disk Utilization, Baseline. An envelope indicating the expected disk utilization range based on historical data.
Disk Utilization, Transfer Rate. The rate at which the server reads and writes data to the disk during the selected time period.
Memory Usage. The current percentage of the average memory usage by the selected server, based on the total memory capacity.
Memory Utilization, % Used. The percentage of the available memory that the server uses during the selected time period.
Memory Utilization, Baseline. An envelope indicating the expected memory utilization range based on historical data.
Network I/O. The current rate at which the selected server transfers data from and to the network.
Network Utilization, Baseline. An envelope indicating the expected network utilization range based on historical data.
Network Utilization, Transfer Rate. The rate at which the selected server transfers data from and to the network during the selected time period.

Drill down on:

CPU Load spinner. Displays the CPU Load dialog box.
Figure 63. CPU Load dialog box
CPU Utilization graph. Displays the CPU Utilization dialog box.
Figure 64. CPU Utilization dialog box
Disk I/O spinner. Displays the Disk I/O dialog box.
Figure 65. Disk I/O dialog box
Disk Utilization graph. Displays the Disk Utilization dialog box.
Figure 66. Disk Utilization dialog box
Memory Usage spinner. Displays the Memory Usage dialog box.
Figure 67. Memory Usage dialog box
Memory Utilization graph. Displays the Memory Utilization dialog box.
Figure 68. Memory Utilization dialog box
Network I/O spinner. Displays the Network I/O dialog box.
Figure 69. Network I/O dialog box
Network Utilization graph. Displays the Network Utilization dialog box.
Figure 70. Network Utilization dialog box


Shows the name of the selected SOFS server and its basic configuration, including the Total I/O, IOPS, Latency, Volume, Total Space, Weekly Growth Rate, and Time to Full.

SCVMM server monitoring

A System Center Virtual Machine Manager (SCVMM) is a management solution for a Hyper-V environment. It allows you to manage host, networking, and storage resources when creating and deploying virtual machines to virtual clouds.

To review data collected about a specific SCVMM server or all SCVMM servers, make your selection in the Quick-View.

관련 문서

The document was helpful.

평가 결과 선택

I easily found the information I needed.

평가 결과 선택