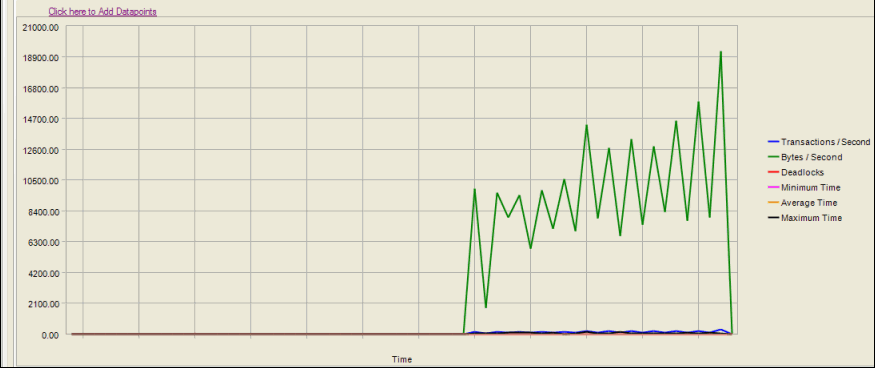
Analysis is the ultimate goal of your load test. When you run a test, you get results both in real-time and in a saved format. Benchmark Factory provides you with testing results that are easy to interpret and allows you to attribute individual results to individual tasks and users.
Graphs
Whether you are viewing a real-time or historical graph, Benchmark Factory uses the same graphing tool. In most cases you will find that the graphs are presented in the most meaningful form. The Benchmark Factory graphing tool allows you to customize graphs to tailor your load testing viewing requirements.
Benchmark Factory provides the following ways to view test results:
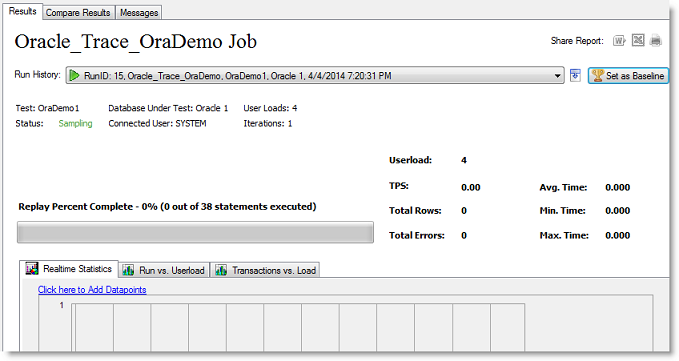
While a job is running, the Results page displays job progress and real-time statistics information. You can monitor the status of the test, see which user load its running, view transactions per second (TPS), and view a variety of other data points that give you insight into the actual performance your database provides under the user load being tested.
You can also view real-time statistics while a job is running. Real-time statistics provide insight into the performance of the database being tested. Numerous data points allow you to examine exactly how your database is performing.
See also, View Test Results - Completed Job.
To view progress and results during job execution
The Results page displays. This page shows the status of the job, the progress of the current step that is executing (such as loading data or sampling), as well as other data such as which user load is running.
To view real-time statistics during job execution
Iteration overruns occur at the end of an iteration to allow time for all transactions submitted within the test iteration cycle to complete, so that all transaction statistics can be collected. For example, an agent may execute a transaction during the last five seconds of test iteration, if this transaction takes 15 seconds to complete, an iteration overrun of 10 seconds will occur.
While a job is running, the Results page displays job progress and real-time statistics information. You can monitor the status of the test, see which user load its running, view transactions per second (TPS), and view a variety of other data points that give you insight into the actual performance your database provides under the user load being tested.
You can also view real-time statistics while a job is running. Real-time statistics provide insight into the performance of the database being tested. Numerous data points allow you to examine exactly how your database is performing.
See also, View Test Results - Completed Job.
To view progress and results during job execution
The Results page displays. This page shows the status of the job, the progress of the current step that is executing (such as loading data or sampling), as well as other data such as which user load is running.

To view real-time statistics during job execution
Iteration overruns occur at the end of an iteration to allow time for all transactions submitted within the test iteration cycle to complete, so that all transaction statistics can be collected. For example, an agent may execute a transaction during the last five seconds of test iteration, if this transaction takes 15 seconds to complete, an iteration overrun of 10 seconds will occur.
The Realtime Statistics tab in the Results page provides you with real-time graphs and raw data. This data allows you to spot system-under-test issues that may be affecting server performance. The Realtime Statistics tab displays real-time counter data. Right-clicking inside the graph displays a drop-down that allows you to change graph settings and view.
To view Real-time Statistics
In the Jobs View, click the job running.
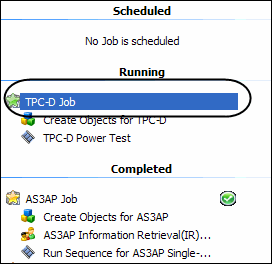
Select Click here to Add Data points. The Add Data points dialog displays.
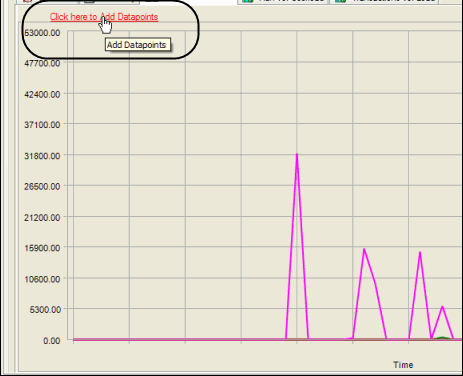
Select the desired data points to view.
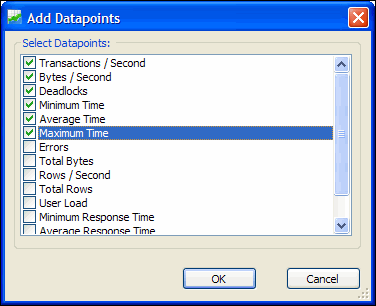
Click OK. The graph displays with the selected data points. (To change graph views, right-click. )
