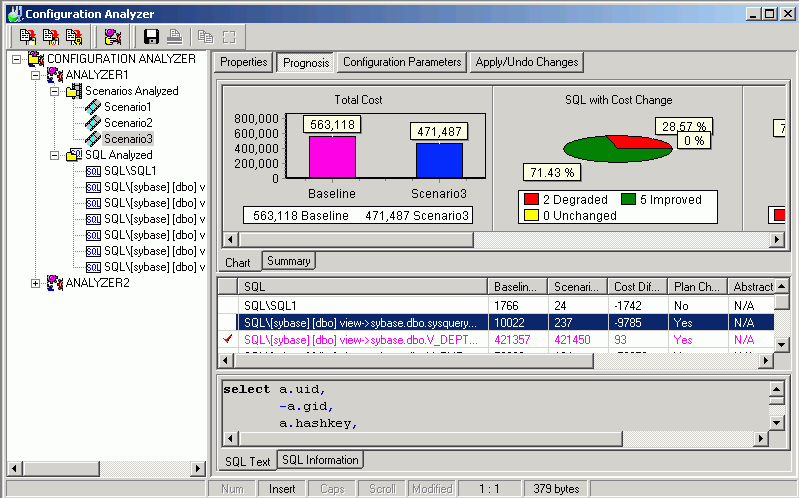
The Configuration Analyzer window displays the information about the SQL statements that are saved in the Configuration Analyzer. The display in the right section of the window depends on what is selected in the left pane.

Provides a tree view of the Analyzers that provide performance analysis information for different configuration Scenarios. For each Analyzer two folders are provided. Review the following for additional information:
| Migration Information | Displays performance analysis information for configuration Scenarios |
| SQL Analyzed | Displays the SQL statements selected from the SQL Repository for analysis and the query plans for each of the Scenarios. |
The right pane displays a variety of different information depending upon what is selected from the tree diagram in the left pane. Review the following for additional information:
| Analyzers | .Right Pane for Analyzers |
| Scenarios Analyzed Folder | Right Pane for Scenarios |
| Scenario | Right Pane for Scenarios |
| SQl Analyzed Folder | Right Pane for SQL Analyzed Folder |
| SQL Statements | Right Pane for SQL Statement |
In the Configuration Analyzer window, when an Analyzer is selected in the left pane, the following information displays in the right pane.
Displays general information about the analysis, information on the connection used to retrieve the query plans and the SQL statements used in the analysis.
In the Configuration Analyzer window, when Scenarios Analyzed is selected in the left pane, the following information displays in the right pane.
Provides a summary of the Estimated I/O Cost and SQL classification for the SQL statements before and after the configuration parameters were changed.
Charts the total Estimated I/O Cost of the SQL statements before and after the configuration parameters were changed.
In the Configuration Analyzer window, when a specific Scenario is selected in the left pane, the detailed information about the Scenario displays in the button pages in the right pane. The buttons for displaying specific information are found at the top of this pane.
Displays general information about the SQL statement and the database settings at the time of the analysis.
Displays 3 panes in the right section of the window.
Charts and Summary tabs [Top right pane]
The Chart tab displays five charts of the comparison information for the query plans from before the analysis and during the analysis.
The Summary tab displays summarized statistics for the Scenario,
SQL Classification and Plan Change Comparisons [Middle right pane]
A grid displays the information about each query plan from before the analysis and during the analysis in a comparison format.
SQL Text and SQL Information tabs [Bottom right pane]
The SQL statement that is highlight in the middle right pane is the one that displays in this pane.
The SQL Text tab displays the text of the SQL statement.
The SQL Information tab displays two SQL Information panes, one for the SQL information before the analysis and one for the SQL Information with the parameter changes.
Displays the database parameter changes used in this analysis displaying the parameter name, the value during the analysis and the old value for the parameters that were changed.
Displays the scripts for changing the configuration parameter on Adaptive Server. Click Execute located at the right of the Configuration Analyzer window to run the script.