Hyper-V Explorer Storage
This tab only appears when you are exploring individual servers. It displays an organized view of physical drive and logical disk activity. It identifies the physical drives with the highest disk activity, and the logical drives with the lowest capacity. Use this information to fine-tune your configuration, achieve optimal results, and avoid bottlenecks. In addition, this tab lists all physical drives for the selected server, their read and write rates, along with the logical drives, the space used on each drive, data growth patterns, and related estimates.
The appearance of this tab depends on the object or group of object selected. For example, exploring a cluster shows data transfer rates for each disk volume connected to the selected cluster, among other metrics, while exploring a virtual machine reveals the current utilization of disk resources for that virtual machine.
Hyper-V Explorer Storage tab (clusters)
The Hyper-V Explorer Storage tab displays combination of embedded views displaying disk volumes associated with the selected cluster. It identifies the virtual machines that spend the highest amounts of disk resources. Use this tab to find out more about the overall consumption of disk resources for a given cluster. The information provided on this tab can help you prevent potential bottlenecks by reallocating disk resources where they are most needed.
This tab appears in the Hyper-V Explorer when you select a cluster on the Hyper-V Explorer Topology tab.
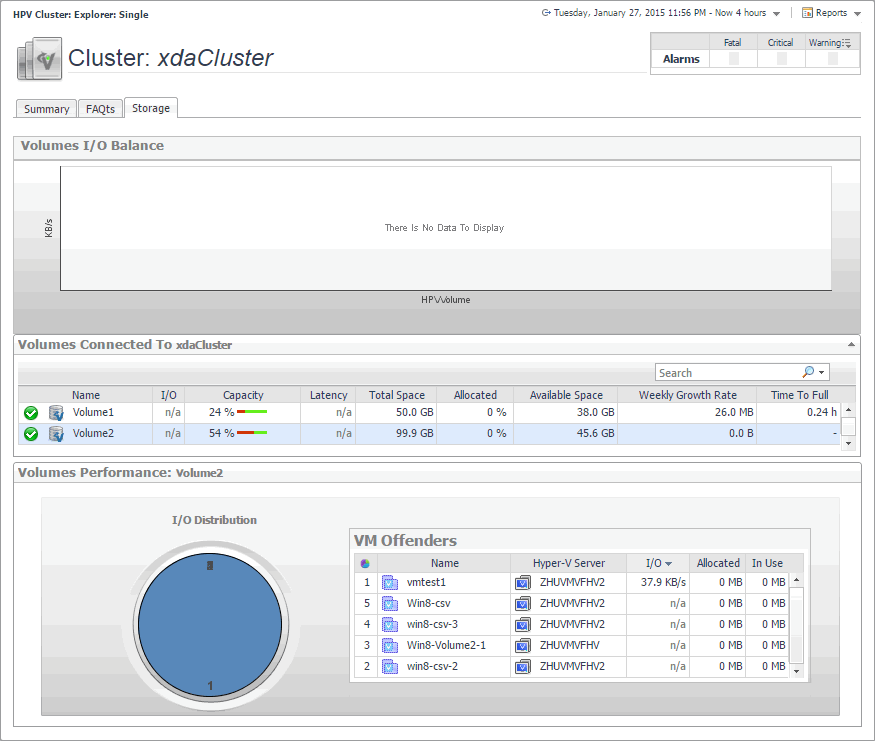
This tab is made up of the following embedded views:
Hyper-V Explorer Storage tab (Hyper-V servers)
The Hyper-V Explorer Storage tab displays combination of embedded views displaying disk volumes associated with the selected Hyper-V server. It identifies the virtual machines that spend the highest amounts of disk resources. Use this tab to find out more about the overall consumption of disk resources for a given Hyper-V server. The information provided on this tab can help you prevent potential bottlenecks by reallocating disk resources where they are most needed.
This tab appears in the Hyper-V Explorer when you select a Hyper-V server on the Hyper-V Explorer Topology tab.

This tab is made up of the following embedded views:
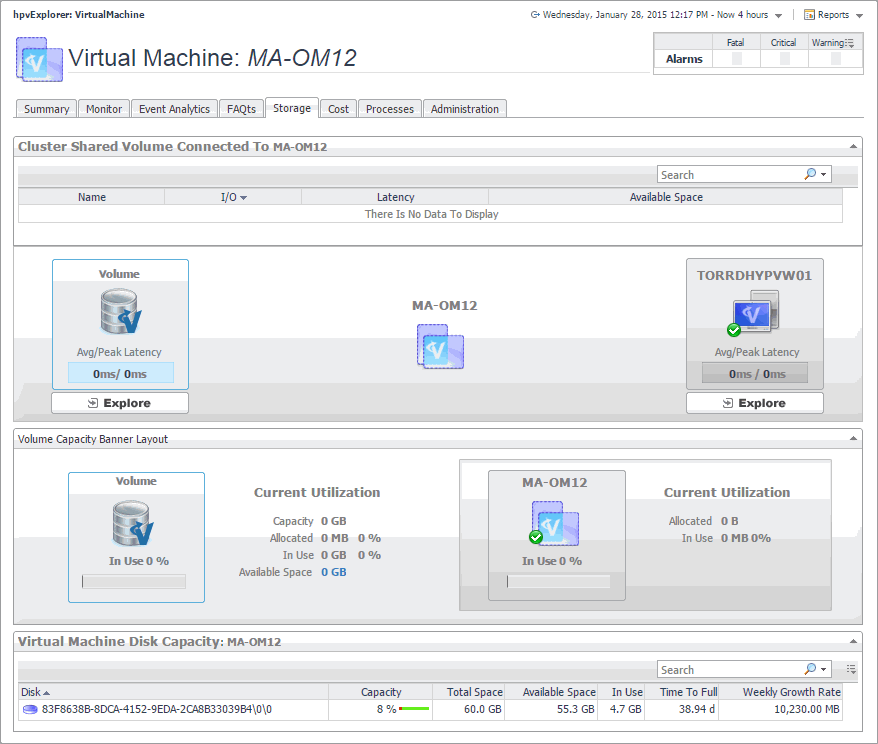
Hyper-V Explorer Storage tab (virtual machines)
The Hyper-V Explorer Storage tab displays combination of embedded views displaying disk volumes associated with a selected virtual machine. It identifies the virtual machines that spend the highest amounts of disk resources. Use this tab to find out more about the overall consumption of disk resources for a given virtual machine. The information provided on this tab can help you prevent potential bottlenecks by reallocating disk resources where they are most needed.
This tab appears in the Hyper-V Explorer when you select a virtual machine on the Hyper-V Explorer Topology tab.
This tab is made up of the following embedded views:
