Hyper-V Explorer Summary (All Servers) tab
The Hyper-V Explorer Summary (All Servers) tab shows a summary of system resources for all physical servers that currently exist in your integrated infrastructure.
This tab appears in the Hyper-V Explorer when you select the Servers node on the Hyper-V Explorer Topology tab.

|
|
This tabular view lists all servers that exist in your environment. |
|
|
|
• |
Server, CPU. The current amount of the CPU speed that is used by the server. | |
|
|
|
|
|
|
• |
Server, Memory. The current percentage of memory that is used by the server. | |
|
|
|
• |
Server, NICs. The number of network interface cards used by the server. | |
|
|
|
|
|
|
• |
Server, Status. The server status, associated with any alarms raised against it. If no alarms are fired, the status appears as Normal. Otherwise, the status is set to the highest alarm severity (Warning, Critical, or Fatal). | |
|
|
|
• |
Server, Version. The version number of the Windows OS running on the server. | |
|
|
|
|
|
|
|
|
Drill down on any server entry. The Hyper-V Environment dashboard appears, showing the server details on the Hyper-V Explorer Summary tab. |
|
|
The Hyper-V Explorer’s Virtual Environment view displays a high-level overview of your virtual environment. The view has a tile for each type of object in your virtual infrastructure: Clusters, Servers, and Virtual Machines. Each tile shows how many of the corresponding object instances there are in your virtual infrastructure, as well as the count of objects of that type in each of the alarm states (Normal, Warning, Critical, Fatal). |
|
|
|
• |
Alarm counts. The total counts of alarms associated with the clusters, servers, or virtual machines, broken down by alarm types (Normal, Warning, Critical, Fatal). | |
|
|
|
• |
Cluster count. The number of physical servers in your virtual environment. | |
|
|
|
• |
Server count. The number of physical servers in your virtual environment. | |
|
|
|
|
|
Drill down on: |
|
|
|
• |
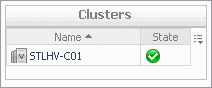
Clusters. Displays the Clusters dwell, showing the names and states of all clusters in your environment. |
|
|
|
|
• |
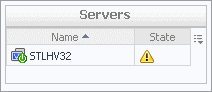
Servers. Displays the Servers dwell, showing the name and state of all servers in your environment. |
|
|
|
|
• |
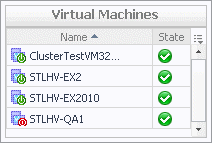
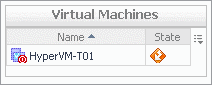
Virtual Machines. Displays the Virtual Machines dwell, showing the names and states of all virtual machines in your environment. |
|
Hyper-V Explorer Summary (All Virtual Machines) tab
The Hyper-V Explorer Summary (All Virtual Machines) tab shows a summary of system resources for all virtual machines that currently exist in your integrated infrastructure.
This tab appears in the Hyper-V Explorer when you select the Virtual Machines node on the Hyper-V Explorer Topology tab.
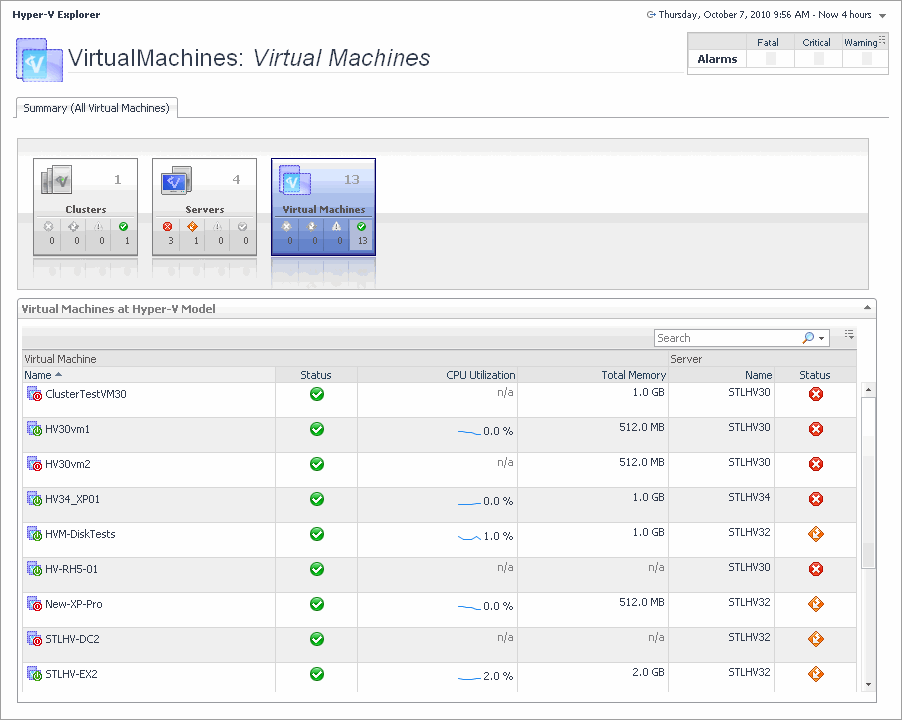
This tab is made up of the following embedded views:
|
|
The Hyper-V Explorer’s Virtual Environment view displays a high-level overview of your virtual environment. The view has a tile for each type of object in your virtual infrastructure: Clusters, Servers, and Virtual Machines. Each tile shows how many of the corresponding object instances there are in your virtual infrastructure, as well as the count of objects of that type in each of the alarm states (Normal, Warning, Critical, Fatal). |
|
|
|
• |
Alarm counts. The total counts of alarms associated with the clusters, servers, or virtual machines, broken down by alarm types (Normal, Warning, Critical, Fatal). | |
|
|
|
• |
Cluster count. The number of physical servers in your virtual environment. | |
|
|
|
• |
Server count. The number of physical servers in your virtual environment. | |
|
|
|
|
|
Drill down on: |
|
|
|
• |
Clusters. Displays the Clusters dwell, showing the name and state of all clusters in your environment. |
|
|
|
|
• |
Servers. Displays the Servers dwell, showing the name and state of all servers in your environment. |
|
|
|
|
• |
Virtual Machines. Displays the Virtual Machines dwell, showing the names and states of all virtual machines in your environment. |
|
|
|
This tabular view lists all virtual machines that exist in your environment. |
|
|
|
• |
Server, Name. The name of the server on which the virtual machine is running. | |
|
|
|
• |
Server, Status. The status of the server on which the virtual machine is running, associated with any alarms raised against it. If no alarms are fired, the status appears as Normal. Otherwise, the status is set to the highest alarm severity (Warning, Critical, or Fatal). | |
|
|
|
|
|
|
|
|
|
• |
Virtual Machine, Status. The virtual machine status, associated with any alarms raised against it. If no alarms are fired, the status appears as Normal. Otherwise, the status is set to the highest alarm severity (Warning, Critical, or Fatal). | |
|
|
|
|
|
Drill down on any virtual machine entry. The Hyper-V Environment dashboard appears, showing the server details on the Hyper-V Explorer Summary tab. |
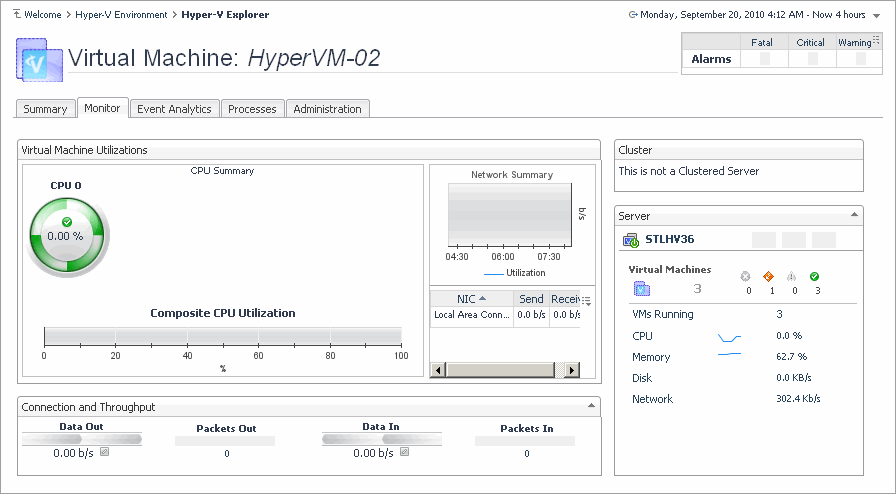
Hyper-V Explorer Monitor
The Hyper-V Explorer Monitor tab appears when you are exploring individual servers and virtual machines. It provides more details about the component’s resource usage, such as the utilization of each individual CPU, server, and cluster performance, and the data throughput rate.
Hyper-V Explorer Monitor tab
The Hyper-V Explorer Monitor tab shows details of system resources consumption for a server or a virtual machine.
This tab appears in the Hyper-V Explorer when you select a server or a virtual machine on the Hyper-V Explorer Topology tab.
This tab is made up of the following embedded views:
|
|
Shows the details about the cluster to which the selected server belongs.
|
|
|
|
• |
Cluster. The name of the server cluster to which the selected server belongs, followed by the total counts of alarms associated with the cluster, broken down by alarm types (Normal, Warning, Critical, Fatal). | |
|
|
|
• |
Servers. The number of all servers associated with the cluster, including running and turned-off servers. | |
|
|
|
• |
VMs. The number of all virtual machines that exist on the selected server, including running and powered-off virtual machines. | |
|
|
|
|
|
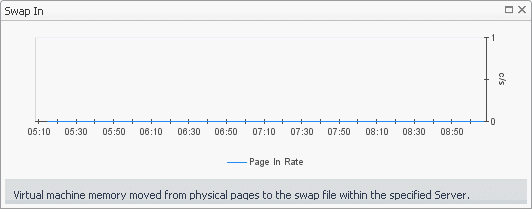
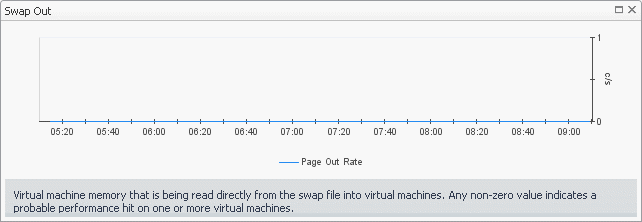
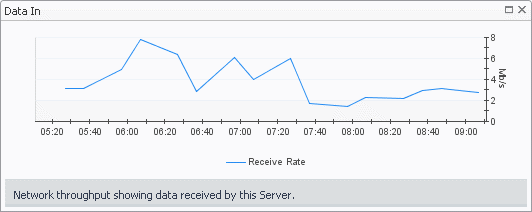
Shows the current state of the server associated with the selected virtual machine, its current resource consumption, and indicates the number of virtual machines associated with the server.
|
|
|
|
• |
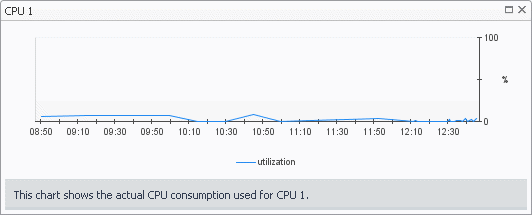
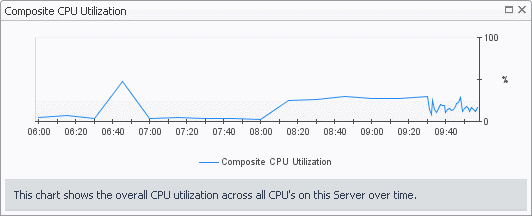
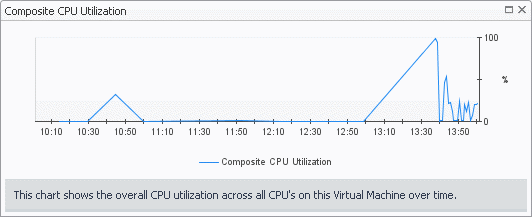
CPU. The current percentage of the server’s CPU load, used to execute system code and user programs, based on the total CPU capacity. | |
|
|
|
• |
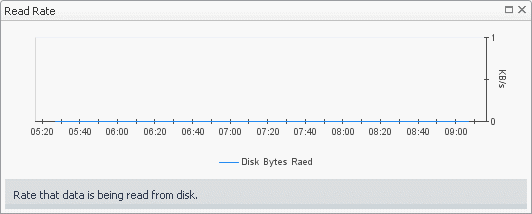
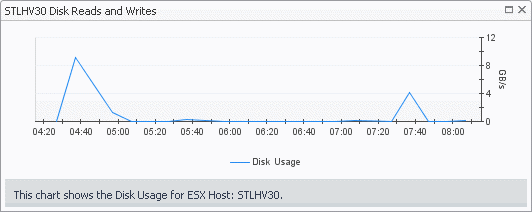
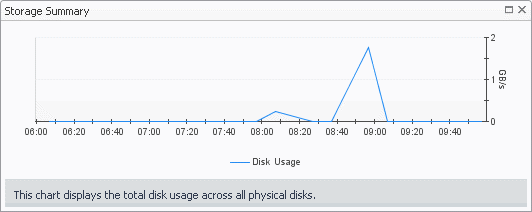
Disk. The server’s current disk I/O rate. | |
|
|
|
• |
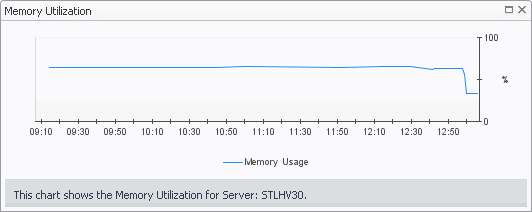
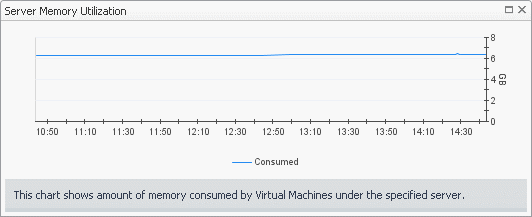
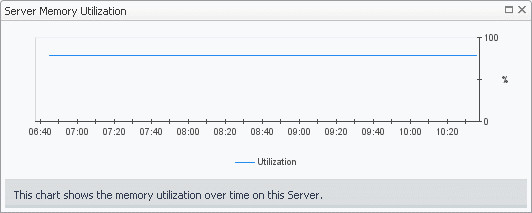
Memory. The current percentage of the server’s memory usage | |
|
|
|
• |
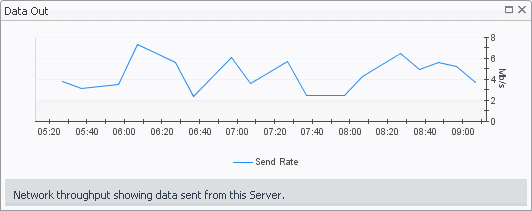
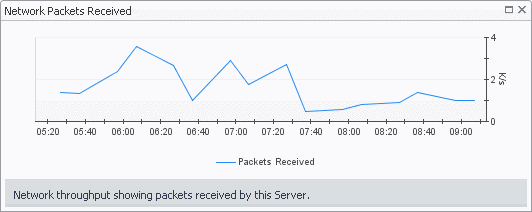
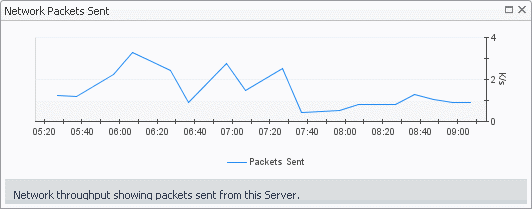
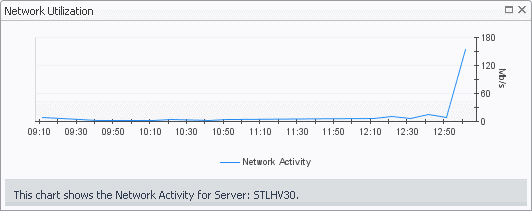
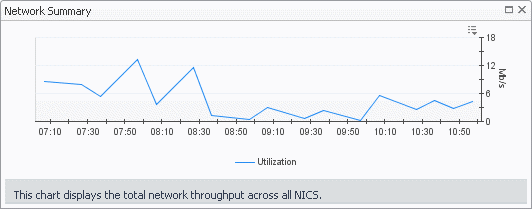
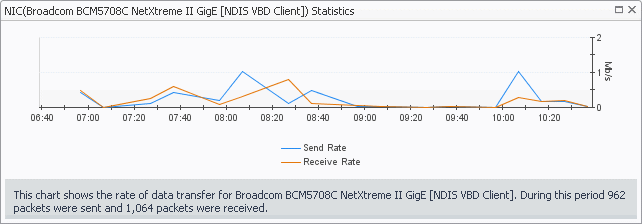
Network. The current rate at which the server transfers data from and to the network. | |
|
|
|
• |
Virtual machines. The number of the virtual machines associated with the server, followed by the counts of all alarms associated with the virtual machines, broken down by the alarm state (Normal, Warning, Critical, Fatal). | |
|
|
|
• |
VMs Running. The number of the virtual machines associated with the server that are currently running. | |
|
|
Drill down on: |
|
|
|
|
|
|
• |
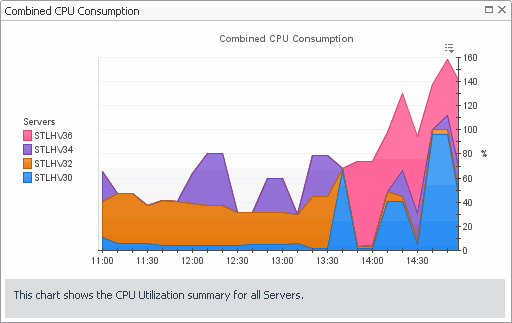
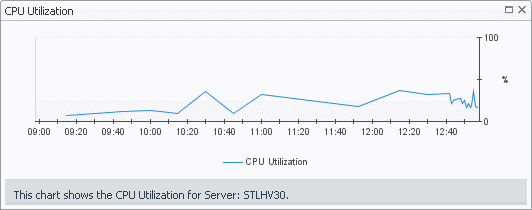
CPU. Displays the CPU Utilization dialog box. |
|
|
|
|
• |
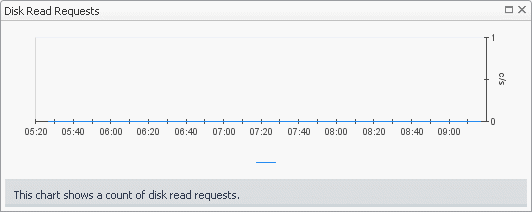
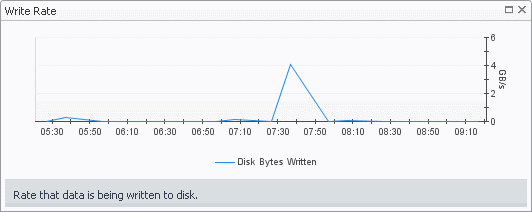
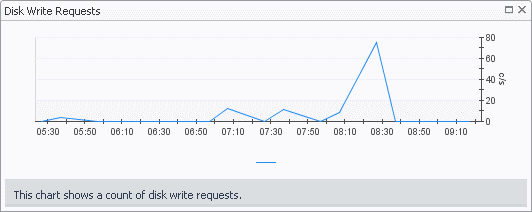
Disk. Displays the Disk Reads and Writes dialog box. |
|
|
|
|
|
|
|
• |
Network. Displays the Network Utilization dialog box. |
|
|
|
|
|
|
|
• |
Virtual Machines. Displays the Virtual Machines dwell, showing the names and states of all virtual machines name associated with the server. |
|
|
|
Shows a list of virtual machines associated with the selected server.
|
|
|
|
• |
Running. The number of the virtual machines associated with the server that are currently running. | |
|
|
|
• |
Virtual Machine. For each virtual machine that is associated with the selected server, and is currently running, there is an entry showing the name of the virtual machine followed by the total counts of alarms associated with the virtual machine, broken down by alarm types (Normal, Warning, Critical, Fatal). | |
|
|
|
• |
Virtual machines. The number of the virtual machines associated with the server, followed by the counts of all alarms associated with the virtual machines, broken down by the alarm state (Normal, Warning, Critical, Fatal). | |
|
|
Drill down on: |
|
|
|
|
|
|
|
|
|
• |
Virtual Machines. Displays the Virtual Machines dwell, showing the names and states of all virtual machines associated with the server. |
|