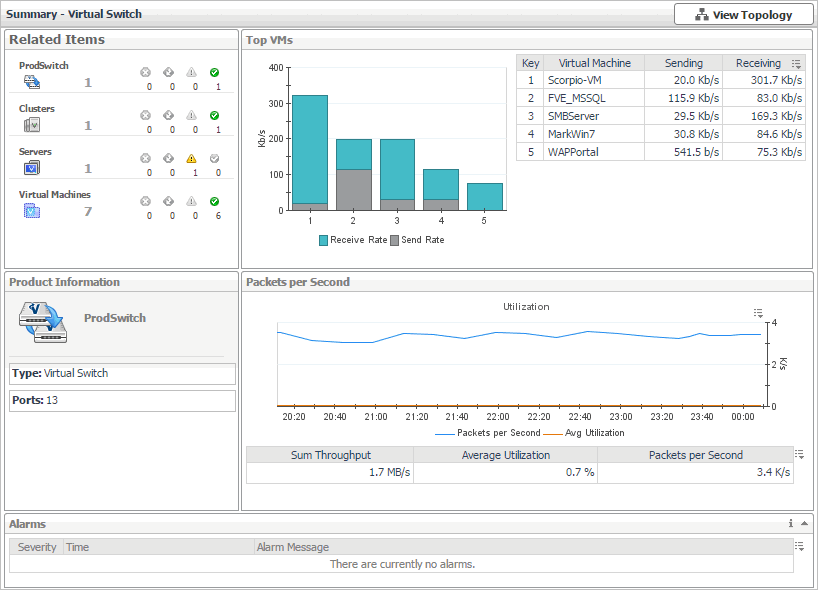
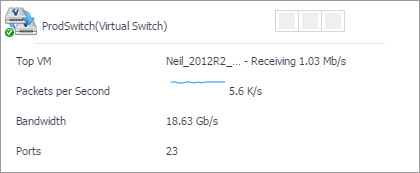
The Summary - Virtual Switch view illustrates the overall network utilization and the levels of overall network traffic for a selected virtual switch.
This view appears in the Quick-View on the left when you select
a virtual switch in the
Virtual Switches view.
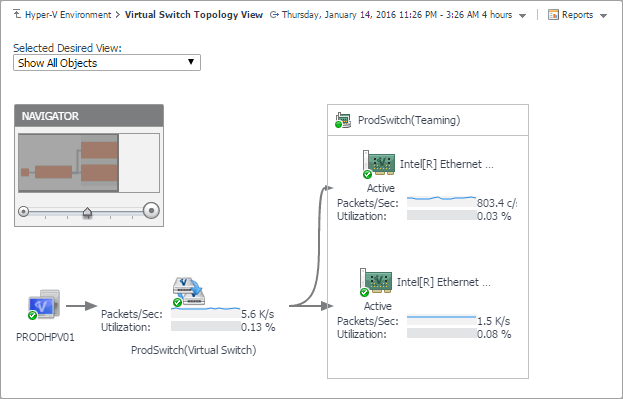
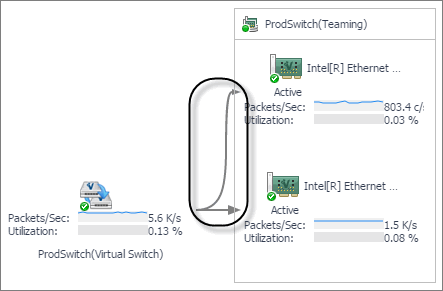
The Virtual Switch Topology View visualizes the relationships between the objects in your environment through an interactive map. The map illustrates how different components relate to each other, and the levels of the available resources available to them.
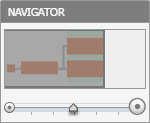
In a large multi-component environment, dependency maps are likely complex and may not fit your screen. The NAVIGATOR in the top-right corner allows you to easily set the zoom level by dragging the slider into the appropriate position.
The Hyper-V Environment dashboard contains the FAQts tab that you can use to ask questions about your monitored systems and review the answers. In the
Categories pane, the
FAQts view shows several question categories. Clicking a category shows the questions belonging to that category in the
Questions pane. From there, clicking a question shows the answer on the right.
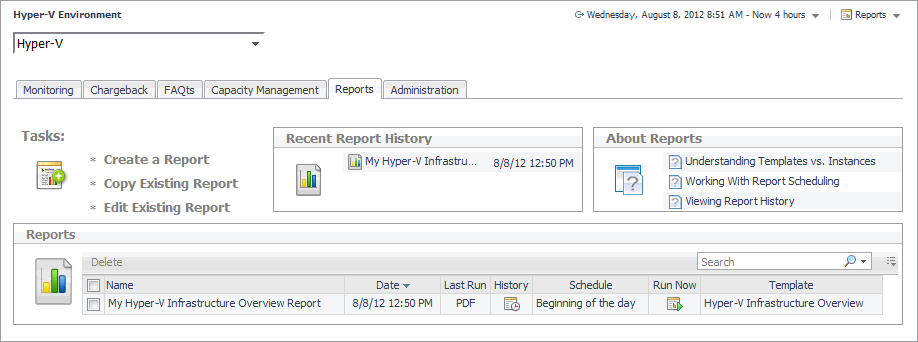
You can generate, copy, and edit reports using the Reports tab on the Hyper-V Environment dashboard, or alternatively the Reports dashboard included with the Management Server.
For more information on how to use this tab to create and manage reports, see the Managing Capacity in Virtual Environments User Guide. For more information about the Reports dashboard, see the
Foglight User Help.