This Foglight for Application Servers User Guide provides instructions and conceptual information about how to monitor and display .NET and Java EE Technologies metrics, and JMX metrics from JMX-enabled systems.
|
• |
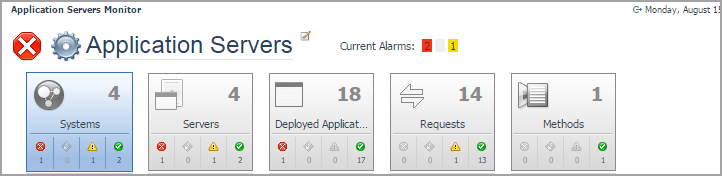
On the navigation panel, under Dashboards, click Application Servers > Monitor. |
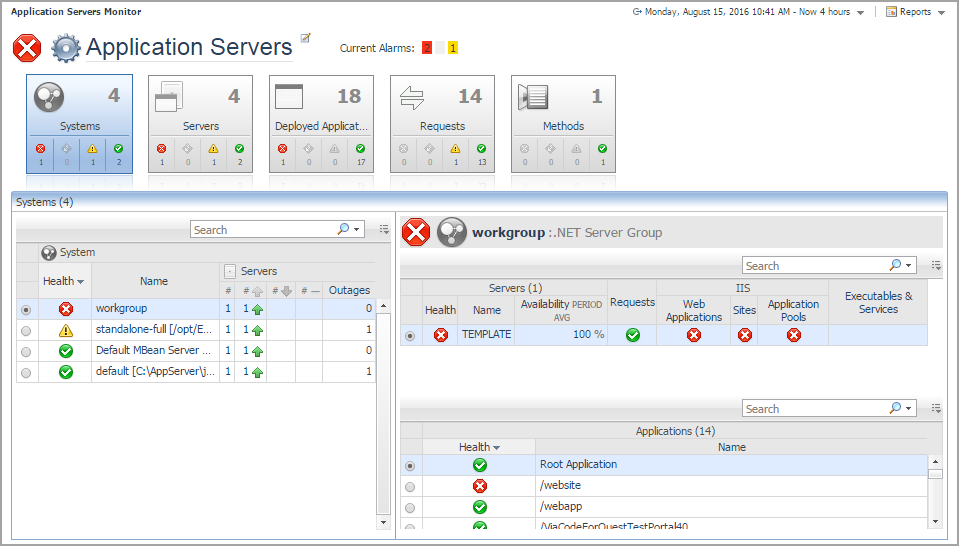
If you want to view only a specific subset of services (such as only All .NET Systems), you can select the service.
|
1 |
On the navigation panel, under Dashboards, click Application Servers > Monitor. |
|
2 |
|
3 |
In the Service Selection dialog box that opens, select the name of the service you want to display on the dashboard. |
|
4 |
Click OK. |
Click a tile to access the views for that category. For more information, see:
|
3 |
Click Apply. |
On the Application Servers Monitor dashboard, click the number next to Current Alarms: to open the Alarm Summary dialog box that lists the details of the current alarms.
For more information about managing alarms, see Viewing, Acknowledging, and Clearing Alarms in the Foglight User Help.