For example, a request type is experiencing high response times and you have a rule that sends alarms when it reaches the threshold. You can specify the RequestTracesAction to collect single traces on a specific request type to monitor the issue.
|
1 |
On the navigation panel, under Dashboards, click Administration > Rules & Notifications > Rule Management. |
|
3 |
From the menu that opens, select View and Edit. |
|
4 |
In the Rule Detail dialog box that opens, click Rule Editor. |
|
5 |
Click the Conditions, Alarms & Actions tab. |
|
7 |
|
8 |
Click Add to add the RequestTracesAction. |
|
• |
Request Type — Use this action parameter to specify unique request types. |
|
• |
Collect Parameters — Use this action parameter to collect all parameters. |
|
• |
Collect in full detail — Use this action parameter to indicate whether you want to collect methods in full detail or component detail (the default). |
|
• |
Count — Use this action parameter to specify the number of traces being collected. |
|
• |
Criteria — Use this action parameter to specify one or more criteria. |
|
• |
Duration — Use this action parameter to indicate the time period to collect the number of traces. |
|
• |
Is Regular Expression — Use this action parameter if you want to specify the Request Type using regular expressions to match the request type for a single trace collection. |
|
• |
Match All criteria — Use this action parameter to limit the trace collection to all or any of the following criteria: |
|
• |
The agent name IDs — Use this action parameter to specify the agentNameIDs property of the agent that you want to collect traces on. |
|
• |
Track SQL Parameters — Use this action parameter to track SQL bind variable values. The default value is set to Off. |
|
9 |
In the Value column for Request Type, click Default and specify the value. |
|
10 |
For more information about rules, see Getting started: view and edit rule definitions in the Foglight Administration and Configuration Help.
When you have a group of request types for which you want to collect single traces using the same criteria, set the criteria using a Groovy script called from the command line (for example, using fglcmd). The collected single traces are stored on the Foglight Management Server, and displayed in the Application Servers Monitor > Requests view for users to review. Use the following function to trigger the collection of requested traces.
This function is used to collect traces in Groovy. Set all the following arguments:
|
Request type for which to collect a trace defined as regular expression (true/false). | |
|
Collect in Full Detail (true/false). For details about instrumentation levels, see Appendix: Application Methods in the Foglight for Java EE Technologies Installation Guide. | |
Criteria are specified as a list of one or more strings.
1 Criteria are in milliseconds.
After you have configured trace collection, you can review the trace details through the Traces view.
|
1 |
On the navigation panel, under Dashboards, click Application Servers > Monitor. |
|
2 |
On the Application Servers Monitor dashboard, click the Requests tile. |
|
3 |
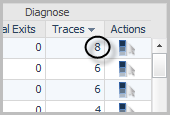
|
4 |
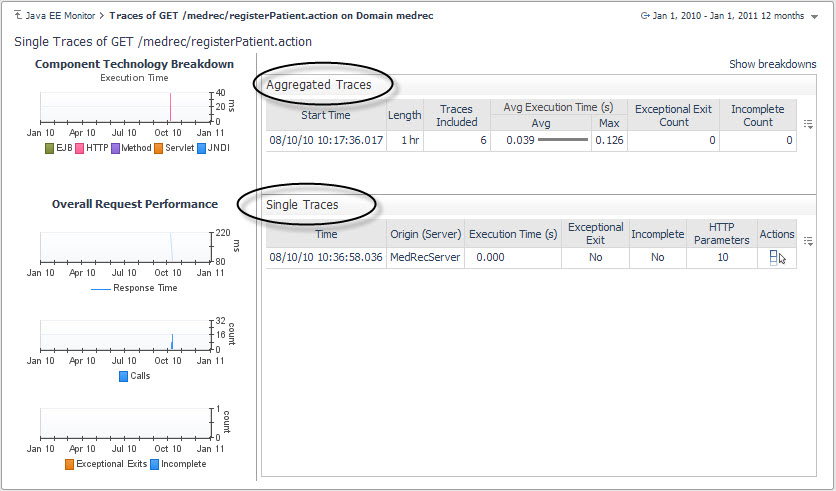
Optional — To view aggregated trace details, click a server name in the Aggregated Traces table, or to view single trace details, click a server name in the Single Traces table. The Trace Diagnosis view opens. |
Use the Traces view to review individual traces of a selected request. This view is divided into four sections: Aggregated Traces table, Single Traces table, Component Technology Breakdown, and Performance charts.
To learn more about how to set a breakdown, see Viewing breakdowns .
