Tchater maintenant avec le support
Tchattez avec un ingénieur du support

Foglight for Microsoft DOT NET 5.9.13 - Application Servers User Guide

Monitoring Application Servers Monitoring Systems Monitoring Servers Monitoring Deployed Applications Monitoring Requests Managing Traces Using Object Tracking to Locate Memory Leaks Monitoring Methods Application Servers Monitor Views
JVM view Method Groups view Request Types view Entity EJBs view Message Driven EJBs view Stateful Session EJBs view Stateless Session EJBs view Deployed Applications view JSPs/Servlets components view Resource Adapters components view Web Applications components view Web Services components view .NET views JBoss Services views Oracle Services views Tomcat Services views WebLogic Services views WebSphere Services views JMX Administration dashboard JMX Explorer dashboard
Appendix: Regular Expressions

Requests table

The Requests table lists all service requests coming from external clients, using HTTP, RMI or other communication protocols. For example, in the Medical Records sample application that ships with WebLogic® servers, the table displays HTTP Get methods for log in, log out, record requests, and administration activities.

Name

Name of the service request.

Health

Health state of how the service requests are processing. Click the health icon to obtain alarm information.

System

System information including name and ID; and domain, cell, cluster topology, or partition type.

Click the system name to display the Domain details.

Path

The context path provides the Service request method and resource name, mapping, and context path.

Completed Calls

The total number of complete calls to a request.

Incomplete Calls

The total number of incomplete calls to a request.

Incomplete %

The percentage of incomplete calls to a request.

Response Time (s)

(Current, Average, Max, and Total (s))

Response Time baseline and threshold values are generated by IntelliProfile. For more information, see Response time baseline and threshold.

Exceptional Exits

Number of requests that were incomplete and resulted in an exception.

Exceptional Exits %

Percentage of requests that were incomplete and resulted in an exception.

Traces

The number of single traces that have been captured. To view single trace details, click the value in the Traces column. For more information, see Managing Traces.

Actions

Opens a menu with two options:

To collect traces, click Collect Traces. The Collect Traces dialog box opens. Use it to configure single trace collection. For more information, see Managing Traces.

The request you select in the Request Types table controls what data appears in the Charts area. By default, the first item in the Request Types table is selected.

Response time baseline and threshold

The Foglight for Application Servers IntelliProfile engine generates baseline and threshold values for the Response Time of request types. IntelliProfile uses data collected during a desired time period and generates a baseline operating range based on the collected metrics. A baseline establishes expected data patterns for a given time period. Baselines are periodically evaluated during IntelliProfile learning cycles, to reflect changes in data patterns.

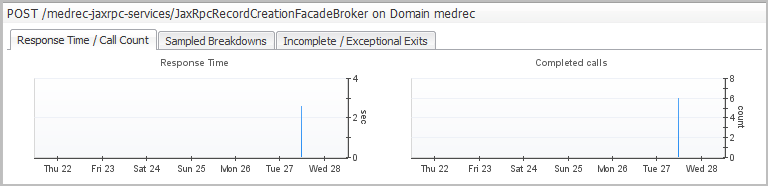
The baseline data for the Response Time appears in the Response Time chart, on the Response Time/Call Count tab.

Threshold states (such as critical or fatal) reflect the degree of deviation from the baseline, and can indicate potential performance bottlenecks. Foglight for Application Servers can generate alarms when the Response Time enters a certain threshold state, based on the rule conditions that evaluate the threshold states.

There are two rules related to Response Time for request types: Request Response Time Baseline Rule and Request Response Time Threshold Rule. These rules are disabled by default.

For more information about the rules, review the rules on the Foglight Rule Management dashboard (Dashboards > Administration > Rules & Notifications > Rule Management > search for “response time”).

For more information about IntelliProfile in Foglight for Application Servers, see Analyzing Activity Levels with IntelliProfile in the Foglight Administration and Configuration Help.

Chart area

The chart area of the Requests view contains graphs and tables of the execution-time data for the selected request over the selected time period. Use the tabs to access more information about Response Time and Call Counts, Sampled Breakdowns, and Incomplete and Exceptional Exits.

Response Time/Call Count tab

The graphs display the historical response time and call count of a request. For each selected request, the graph plots the average, maximum, and minimum values.

When baseline data for the Response Time is available, it appears in the Response Time chart. For more information about baselines, see Response time baseline and threshold .

Adjusting the timeline zonar updates the graphs with the data collected during that time period.

Documents connexes

The document was helpful.

Sélectionner une évaluation

I easily found the information I needed.

Sélectionner une évaluation