Tchater maintenant avec le support
Tchattez avec un ingénieur du support

Foglight for Microsoft DOT NET 5.9.13 - Application Servers User Guide

Monitoring Application Servers Monitoring Systems Monitoring Servers Monitoring Deployed Applications Monitoring Requests Managing Traces Using Object Tracking to Locate Memory Leaks Monitoring Methods Application Servers Monitor Views
JVM view Method Groups view Request Types view Entity EJBs view Message Driven EJBs view Stateful Session EJBs view Stateless Session EJBs view Deployed Applications view JSPs/Servlets components view Resource Adapters components view Web Applications components view Web Services components view .NET views JBoss Services views Oracle Services views Tomcat Services views WebLogic Services views WebSphere Services views JMX Administration dashboard JMX Explorer dashboard
Appendix: Regular Expressions

Selecting a trace to baseline or compare metrics

The Select trace to baseline or compare feature can display the relative performance of a single trace as compared to another single or aggregate trace. Selecting a baseline trace adds columns and fields that show the difference (DIFF) between the currently viewed single trace and the selected baseline trace.

1
4
In the Traces view, click the name of a single trace.
7
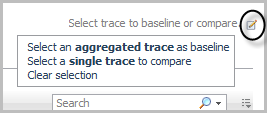
Click the edit icon beside the text Select trace to baseline or compare.
8
In the menu that opens, click Select an aggregated trace as a baseline.
9
In the Select Trace for Comparison Dialog — Aggregated dialog box, click an aggregated trace to use as a baseline for comparison.
The view updates with the message: “Comparing to trace at: <time stamp>”.
2
Click Select a single trace to compare.
3
In the Select Trace for Comparison Dialog — Single dialog box, click a single trace to compare.
2
Click Clear selection.


Using Object Tracking to Locate Memory Leaks

Foglight for Java EE Technologies includes the ability to examine monitored class breakdowns of tracked objects for each application server that participated in a request. You can use the breakdowns to investigate why memory usage problems are occurring for a particular application server.

Over the runtime of an application, objects that are allocated memory in the Java Virtual Machine (JVM) heap become eligible for garbage collection once all references to them have been released. If object references are not released, the objects loiter in memory taking up space that could be reused.

To examine these memory leak problems, you can enable object tracking and review the root of the problem.

Typically several application servers can be used to service a request and this request can cross JVM boundaries. On each JVM, memory is allocated for each application running. When monitoring your JVMs, you may notice a change in the memory performance for all your JVMs. In this situation, you can investigate the memory leak on one JVM first and then narrow down the investigation to find the application causing the leak. Once you have the memory leak source identified, you can then change the code to improve memory allocation for that application to resolve the leak.

You may observe a generally and consistently upward trend in the memory usage of a monitored JVM. For example, this occurs when object instances are added to a persistent, pinned collection but due to a coding error they are never removed. In this case, use object tracking to detect the object instances that are allocated but not collected.

In some situations, although memory usage appears normal, an excessive number of garbage collections may occur. The Foglight Management Server runs garbage collection rules to check on the time spent on garbage collection and if it exceeds a pre-defined threshold, alarms are generated. Excessive garbage collection may happen when allocating unnecessary or redundant object instances in a frequently used code path. While not a leak, this can still be a performance problem due to the garbage collection algorithm using more CPU time than would otherwise be necessary from the applications. In this case, object tracking can detect the most frequently allocated classes, regardless of whether they are collected.

The next step in both of these cases is to look more closely at object allocations in the affected JVM.

Updating object tracking agent properties

Object tracking applies to Foglight for Java EE Technologies only. To use object tracking, specify the packages and classes that you want to monitor in the agent configuration property file. The intention is that object tracking configuration should be changed infrequently. For example, you may change the configuration to include the packages of newly deployed applications that you want to monitor using object tracking.

By default, object tracking is configured such that the Java utility collection classes can be tracked. This may be sufficient for an initial investigation, however, to track objects allocated in your applications, add or replace the default configuration with your own packages.

Configuring object tracking does not enable object tracking; it only specifies what is tracked when you do enable object tracking.

1
On the navigation panel, under Dashboards, click Application Servers > Administration.
5
In the menu that opens, select Edit instrumentation settings.
6
Click the Object Tracking tab.
7
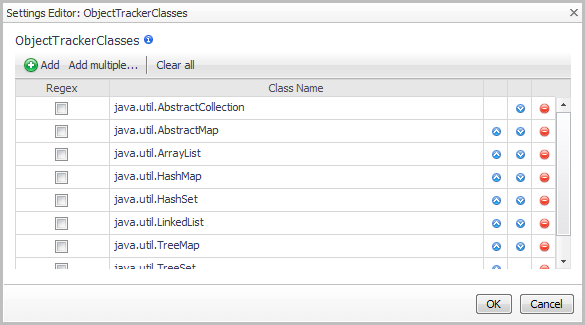
Click the edit icon to the right of ObjectTrackerClasses to update the list of classes being included or excluded.
a
In the Settings Editor dialog box, click Add. A blank row is added to the bottom of the list.
d
Click Add again.
g
Click OK. The new entries are added to the ObjectTrackerClasses list in the Configuration Category Editor dialog box.
IMPORTANT: These settings are valid when the Instrumentation Level is set to FullDetail or ComponentDetail. Changing their values has no effect if the Instrumentation Level is set to BasicDetail or NoDetail.
8
Click Save.
9
Optional — Edit the Nexus recording settings to set the maximum amount of time that the agent tracks a live object (that is, the LiveObjectLifespanLimit). By default, the LiveObjectLifespanLimit is set to 900 seconds.
For detailed information about the Nexus recording settings, see the Managing Nexus Recording Settings section in the Foglight for Application Servers Administration and Configuration Guide.
10
Optional — Edit the Nexus recording settings to set the maximum number of live objects that the agent tracks. By default, the LiveObjectCountLimit is set to 524288.
For detailed information about the Nexus recording settings, see the Managing Nexus Recording Settings section in the Foglight for Application Servers Administration and Configuration Guide.

Foglight for Java EE Technologies provides a suggested lifespan value for the agent to track a live object before marking it as expired. Depending on the complexity of your application along with your JVM heap settings and resulting garbage collection rate, the default value of 900 seconds (15 minutes) may not be appropriate.

An appropriate value for the LiveObjectLifespanLimit property can be derived from your observations of the time between the major garbage collections taking place. If the LiveObjectLifespanLimit is shorter than the time between major garbage collections, the agent may be prematurely marking objects as expired.

If you are able to have object tracking use additional memory, you may want to increase the LiveObjectLifespanLimit value to span the interval between major garbage collections. However, keep in mind that increasing this value does require additional memory within the application server heap.

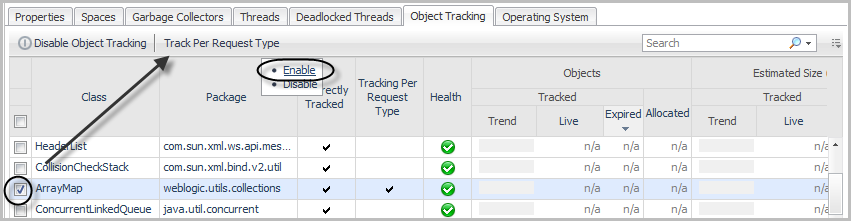
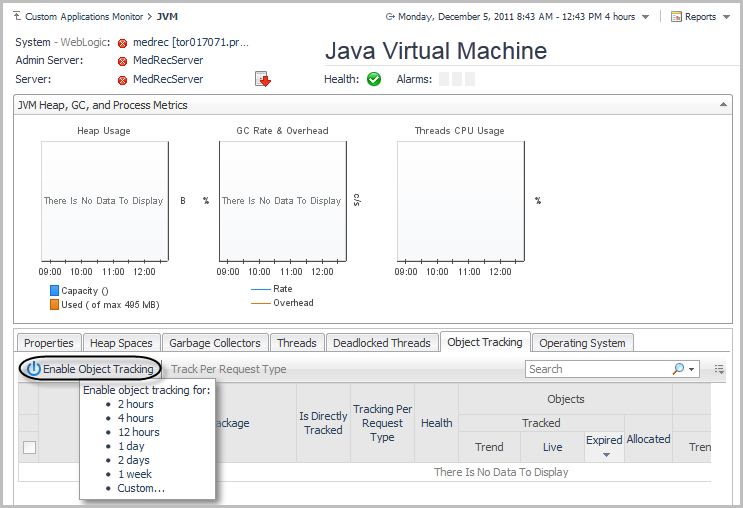
Enabling object tracking

After you have set the required agent properties, enable object tracking for Foglight for Java EE Technologies.

1
On the navigation panel, under Dashboards, click Application Servers > Monitor.
2
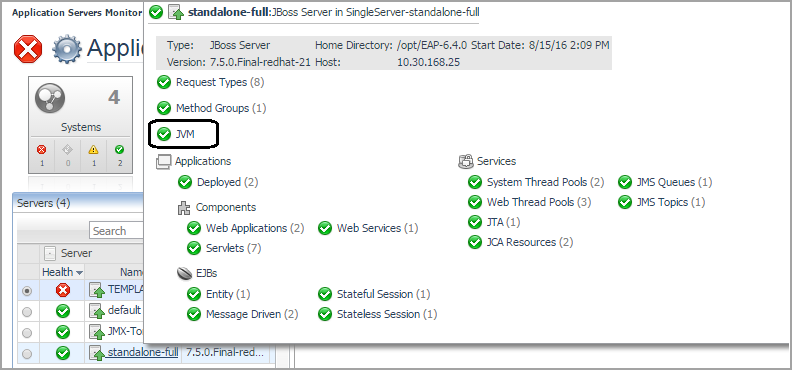
Click the Servers tile and select a server.
3
In the server details view, click JVM (not the status icon).
4
In the Java Virtual Machine (JVM) view, click the Object Tracking tab.
Click Enable Object Tracking.
Select Enable.
Documents connexes

The document was helpful.

Sélectionner une évaluation

I easily found the information I needed.

Sélectionner une évaluation