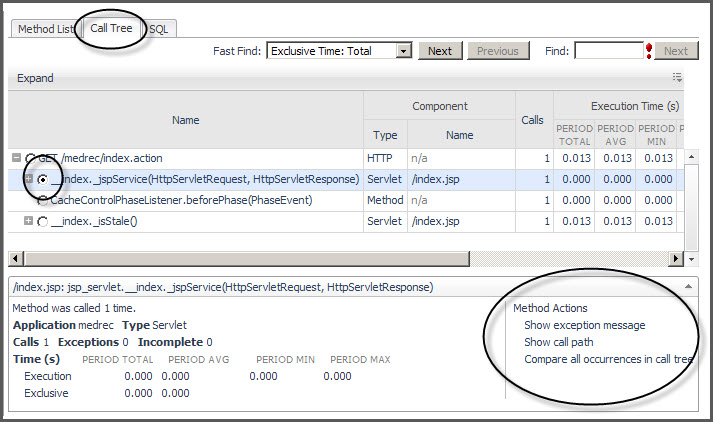
Trace Diagnosis view
You can view the full details for an aggregated or single trace in the Trace Diagnosis view.
To access this view, select a trace by clicking the value in the Time column of either the Aggregated Traces table or the Single Traces table.
Method List tab
|
• |
Show exception message — Use this action when you want to view a list of detailed exception messages for a selected method. |
|
• |
Compare all occurrences in call tree — Use this action when you want to view method metrics along with a unique call path for a selected method. |
Using the Method List table, you can compare a single trace to another single trace or to an aggregate trace to use as a comparison baseline for all the trace metrics. For more information, see Selecting a trace to baseline or compare metrics .
Call Tree tab
|
• |
Show exception message — Use this action when you want to view a list of detailed exception messages for a selected method. |
|
• |
Show call path — Use this action when you want to view the call path for a selected method in a numbered list. |
|
• |
Compare all occurrences in call tree — Use this action when you want to view method metrics along with a unique call path for a selected method. |
The entire tree and sub-trees below any node can be viewed by selecting the node, and then clicking Expand in the top left corner of the tree table.
This functionality finds the most expensive node in the tree based on a selected metric. That row is highlighted in the table, and the tree is expanded up to the selected row. All the metrics in the Request Trace table are listed in the Fast Find drop-down menu and can be used as Fast Find criterion.
Click Next and Previous to move through fast find results.
Use the Find text box to find a particular method by typing part or all a method name. The first occurrence that matches the text is highlighted in the table. Click Next to move to the next occurrence.
From the Call Tree tab, you can compare a single trace to another single trace or to an aggregate trace to use as a comparison baseline for all the trace metrics. For more information, see Selecting a trace to baseline or compare metrics .


