This video below covers how to view Change Tracking included in SQL Performance Investigator (SQL PI) for SQL Server, Oracle, and SQL Server Analysis Services (SSAS).
Change Tracking is an integrated monitoring mechanism. It periodically tracks changes in environments and activity that can potentially influence system performance and enables the user to view correlation between occurrences of changes and SQL Server's activity and behavior patterns.
Use the Categories filter mechanism to refine the set of displayed change tracking occurrences. These categories are displayed on the right-hand side of the pane.
In SQL Server, these categories include
- Accounts – the addition and deletion of login accounts.
- Database Configuration - For each database in an MSSQL instance: configuration parameters, File group parameters; files (data and log) location, size and status.
- Database Objects - For each database in an MSSQL instance: Any schema object: Tables and indexes and their partitions and subpartitions; clustered and non-clustered indexes; constraints; views; functions; procedures; types and triggers (for example, altering a table; altering or rebuilding an index).
- Execution Plan - SQL PI captures SQL statements whose execution plans have changed. When an execution plan has (unintentionally) changed, the outcome can result in SQL performance degradation. Therefore, it is essential you investigate the change, by clicking the Properties button to graphically display the execution plan before and after the change, to verify that the nature and outcome of the change improve SQL performance.
- Master Configuration - Track changes to sp_configure settings, and DBCC trace flags.
- System Configuration - Hardware and operating system configuration (for example, disks and network interfaces (NIC); amount of RAM; CPU count; device installations and swap space allocation).
In Oracle, the change tracking categories include
- Execution plan — SQL statements whose execution plans have changed. Unsuitable execution plans can result in SQL performance degradation.
- Oracle configuration — instance-level configuration, such as init.ora parameters, location of files (data, log, and control), size and status
- Oracle schema — any schema object, such as tables and indexes and their partitions, clusters, constraints, views, and materialized views.
- System configuration — hardware and operating system configuration, such as OS global parameters, amount of RAM, and number of CPU units.
- User-defined — used for documenting changes inserted manually by the user, which can affect performance. Recording this activity can assist in determining whether a change in performance can be directly associated with this event
For SQL Server Analysis Services, the change tracking categories include
- Meta Data — Report on changes to the Analysis Services server configuration and to the underlying database's schema.
- System Configuration — Hardware and operating system configuration (for example, disks and network interfaces (NIC), amount of RAM, CPU count, device installations and swap space allocation).
- User defined — Used for manually documenting user changes that may affect performance. Recording this activity can assist in determining whether a change in performance can be directly associated with this event
How to access the Change Tracking Dashboard
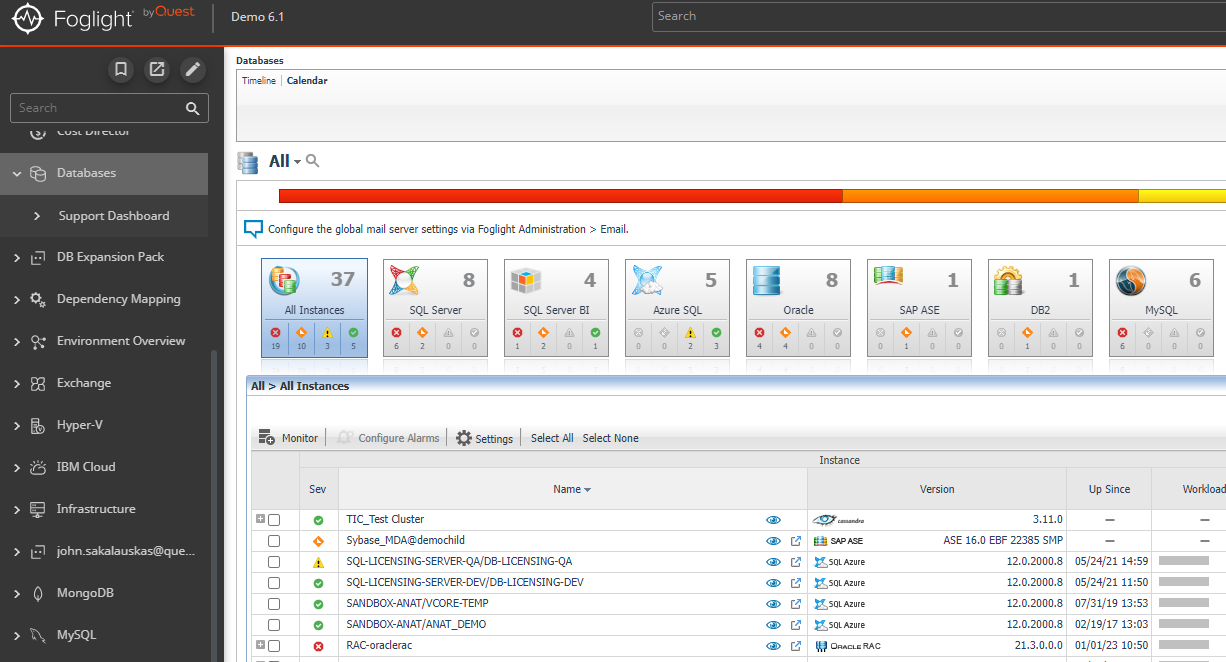
- Navigate to the Global View Databases Dashboard

- Select a database agent monitored with SQL PI, in this example we will use a SQL Server agent
- Select the SQL PI panel for this agent
- Click Advanced Analytics

Note: selecting a specific dimension (such as Databases, Files, or Disks) from the Performance Tree will display only the changes made in this specific dimension. The instance view displays all changes made
Overview
In the panel that appears, colored dots are superimposed over the Resource Consumption chart.
Each dot corresponds to a change tracking category. These can be selected from the list on the right side of the panel with a count of the number of this event logged during the selected time range.
In the panel below, there is a list of all of the changes recorded by the change tracking mechanism during the time period selected. Each event includes the time and date, a description of the event, the category, and may also include the user the event was attributed to for events such as creating a new database table.
By clicking the Add Change button, a user defined change can be added. Enter the date and a brief description of the event to add the new change to the panel. Then click the OK button.
Change tracking collections run at different frequencies, depending on the change tracking category. For example by default, account changes are checked every 24 hours, while database objects are checked once every hour. This means that if a users makes any change to a user account, it would not be visible on the data on PI dashboard until up to 24 hours later. These durations are controlled by hidden agent status property settings and can be change using a groovy script in the Foglight Script console.