
-
Title
How do VMWare and IC cartridges work when collecting OS metrics in Databases monitoring -
Description
How do the Database Cartridges (SQL Server), VMWare, and Infrastructure (IC) Cartridges work in tandem for collecting OS metrics?
-
Cause
The integration between the SQL Server agent and the VMWare agent has been created for data presentation only, there is no data integration being performed between the two agents.
-
Resolution
When adding a new database agent or using the Connection Details functionality in the database agent's administration dashboard, enable the Operating System and VMWare checkboxes to collect OS metrics and indicate to the database agent that the host is a Virtual Machine.

If the Operating System checkbox is not enabled
- SQL Server agents will not display the CPU Load (%) and Memory (%)
- Oracle and DB2 agents will not display the CPU Load (%), Memory (%), and Disk (% Busy)
Click the Specify VMWare Credentials text to enter the login information for the vCenter or ESX Hostname
- If the Specify VMWare Credentials checkbox is enabled then no IC (HostAgent) will be created and only Disk Metrics will be retrieved using VMWare agent data.

One the agent is created or validated, virtual machine metrics in Databases Global View dashboard will be obtain using the vcenter or ESX server.

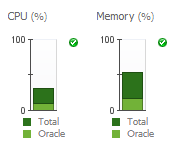
CPU and Memory metrics
Under the Database Overview dashboard, the CPU and memory are being taken from the database agent topologies which are collected by the database agent's own OS collection.
In addition, the DB agent also collects its own VMWare metrics and is used for the "Avg. Virtual Overhead (%)" component in the DB homepage.

Clicking on this drilldown will open up the following dialog with more information about VM CPU overhead and ESX CPU/Memory utilization.

- For DB2 and Oracle cartridges, the disk metrics are collected by the database agent.
- For SQL Server cartridges
- Disk utilization is taken from an HostAgent (IC) or a VMWarePerformance agent (if either one is present).
- If there is no HostAgent (IC) or VMWarePerformance agent, then the Disk (% Busy) will be blank.
In summary, for SQL Server agents monitoring virtual instances
- When OS monitoring is turned off in the database agent, the database dashboard displays CPU and Memory will be unavailable and the OS icon will be red

- When OS monitoring is turned on in the database agent, the database dashboard displays CPU and Memory from the database agent and the OS icon will be green or yellow

- If a HostAgent (IC) exists and the proper resource mapping is configured
- the SQL Server agent will include Disk Utilization metrics (Disk Busy %) in the Globalview databases dashboard from the HostAgent (IC)

- the SQL Server agent will include Disk Utilization metrics (Disk Busy %) in the Globalview databases dashboard from the HostAgent (IC)
- If no HostAgent (IC) agent exists and a VMWarePerformance agent exists
- the SQL Server agent will include Disk Utilization metrics (Disk Busy %) in the Globalview Databases dashboard from the VMWarePerformance agent and the OS icon will be yellow because the database agent disk utilization from VMware and Infrastructure agent measure different metrics.

- the SQL Server agent will include Disk Utilization metrics (Disk Busy %) in the Globalview Databases dashboard from the VMWarePerformance agent and the OS icon will be yellow because the database agent disk utilization from VMware and Infrastructure agent measure different metrics.
- If no HostAgent (IC) agent and no VMWarePerformance agent exists
- the Disk (Busy %) column will be unavailable in the databases dashboard for the host

- the Disk (Busy %) column will be unavailable in the databases dashboard for the host
The recommendation to have SQL Server disk metrics without the cpu/memory topology duplication when the VMWarePerformance agent is not present:
- Add HostAgent (IC) agent
- Turn on radio button for disk metrics
- Turn off radio buttons for other OS metrics
- Establish credentials (if not already present) linking the DB agent to the IC agent