The Desktop Authority Reporting Tool provides several pre-made SQL statements for use in reports. These pre-made SQL statements are made available to provide a jump start for most reports. Click View/Edit SQL Query from the report design surface to create a new SQL query, select a pre-defined query or modify an existing query.

Select a pre-made SQL statement from the SQL drop down list, enter a new SQL statement or modify an existing statement by typing into the textbox.
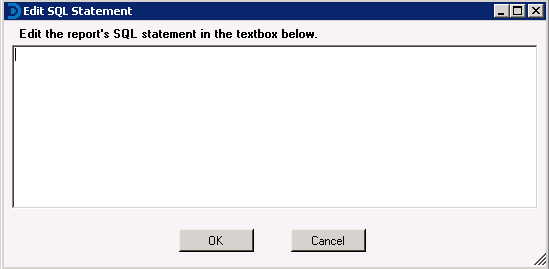
Note: When creating an SQL statement, always start your statement with “SELECT”, “SELECT DISTINCT”, or “IF NOT EXISTS” in order to ensure optimal performance in the Report Designer. If the SQL statement does not start in this way you may notice a lag time when loading a report in the Report Designer or when switching between the Report Designer and Generate Reports.
The Standard toolbar icons are available to for general report actions such as creating, opening and saving reports.
|
Icon |
Action |
Description |
|
|
New Report |
Create a new report |
|
|
Open Report |
Open an existing report |
|
|
Save Report |
Save report |
|
|
Save As Report |
Save report with a new name |
|
|
Undo |
Undo last action |
|
|
Cut |
Cut selected control |
|
|
Copy |
Copy selected control to clipboard |
|
|
Paste |
Paste control from clipboard |
|
|
Delete |
Delete selected control |
|
|
Reorder Groups |
Change the order of report groupings |
The Toolbox toolbar contains icons that represent the type of control to place on the report design surface.
|
Icon |
Action |
Description |
|---|---|---|
|
|
Pointer |
Select controls or sections of the report |
|
|
Label |
Prints static text on the report. |
|
|
Textbox |
Prints a formatted text value |
|
|
Checkbox |
Checkbox is used to print Boolean values as checked or unchecked. |
|
|
Picture |
Prints an image on the report. |
|
|
Shape |
Prints a rectangular or oval shape on the report. |
|
|
Line |
Prints a line on the report. |
|
|
Rich Textbox |
Prints text formatted as Rich Text (RTF) on the report. |
|
|
SubReport |
Prints a linked report object as part of the current report. |
|
|
Page Break |
PageBreak ends the current page and starts a new page at the control's location on the page. |
|
|
Barcode |
The Barcode control is used to print barcode symbology in the report. |
|
|
Charting |
Renders a chart on the report. The Chart control supports many different types of charts. The supported chart types are Area, Area 3D, Bar, Bar 3D, Clustered Bar, Bezier, Doughnut/Pie, Doughnut/Pie 3D, Line, Line 3D, Scatter, Stacked Area, Stacked Bar, Stacked Bar 3D, Stacked Area 100 Pct., Stacked Bar 100 Pct., Stacked Bar 3D 100 Pct., Bubble, BubbleXY, LineXY, PlotXY, Candle, HiLo, and HiLoOpenClose. |
A report can have a single report header section and report footer section that prints at the very beginning and end of each report. The Report Header section is normally used to print a report title, a summary table, a chart or any information that needs only to appear once at the report's start.
The Report Footer prints at the end of the report. It is normally used to print a summary of the report, grand totals or any information that needs to print once at the report's end.
A report can have a single page header section and page footer section that prints at the top and bottom of each page. The Page Header is the first section that prints on the page except when the page contains a Report Header section. The page header section is normally used to print column headers, page numbers, a page title or any information that needs to appear at the top of each page in the report.
The Page Footer prints at the bottom of each page. It is normally used to print page totals, page numbers or any other information that needs to appear at the bottom of each page.
Use parameters in reports to prompt the user for input as the report is being generated.
The parameter dialog is created based on the SQL statement the report is using.
Add <%TableField:[Table Name:] [ Field Name:] [Category] | [User Prompt|] [Default Value|] [Variable Type]%>
to the WHERE or ORDER BY clause of the SQL string for the report to display the Parameters dialog.
Table Name is the name of the table to be used to fill the parameter field with data for selection by the user. This is optional and should only be used when the report parameter field is to be pre-populated with data. A colon (:) must follow the Table Name if this parameter is used.
Field Name is the name of the data field you wish to request from the user as well as the name of the field to pre-fill the parameter drop list with. This is required when defining a report parameter. A colon (:) must follow the Field Name if this parameter is used.
Category Name is used to determine which data set to select data from. It should be filled with either CBM or User. The Category Name is an optional parameter. If this parameter is not specified, both Computer Management and User Management data will be queried.
User Prompt is an optional value which sets the text that is displayed to the user when report parameter data is requested.
Default Value sets a default value for the parameter. For example, if you have a date parameter, you can set the DefaultValue for the field to the current date so users can just hit ENTER unless they want to generate a report based on a different date.
Variable Type indicates the type of the data being requested. The possible values are: nothing (which defaults to string), S for string, D for date, and B for Boolean. A string type provides a textbox for input; a date type provides a calendar drop-down control for input; and a Boolean type provides a checkbox for input.
Example:
SELECT DISTINCT
dbo.HardwareInventory.ComputerIdentificationID 'Computer ID',
dbo.HardwareInventory.ComputerName 'Computer Name',
dbo.SoftwareInventory.Publisher 'Software Publisher',
dbo.SoftwareInventory.DisplayName 'Software Display Name',
dbo.SoftwareInventory.DisplayVersion 'Software Display Version',
dbo.SoftwareInventory.InstallDate 'Software Install Date',
dbo.SoftwareInventory.InstallLocation 'Software Install Location',
dbo.SoftwareInventory.InstallSource 'Software Install Source',
dbo.SoftwareInventory.LastUpdated 'Software Last Updated'
FROM
dbo.HardwareInventory
WHERE
dbo.HardwareInventory.ComputerName LIKE '<%TableField:HardwareInventory:ComputerName|Computer Name: |%|S%>'
ORDER BY
dbo.HardwareInventory.ComputerName, DisplayName
The above example will prompt the user for two parameters, Computer Name and Order By. Notice that the Computer Name parameter is pre-filled with data from the HardwareInventory table.

Report parameters can also be pre-populated with data for selection by the user with the use of a stored procedure. Use a report parameter field name beginning with Sproc. The parameter name starts with the word Sproc, followed by the rest of the parameter name. For example, SprocUserGroup. Follow the stored procedure parameter name by a colon, then the name of the stored procedure.
Example:
<%SprocUserDomainGroups:UserDomainGroups|User Group: |%|S%>
The parameter name is SprocUserDomainGroups and the stored procedure that will be called is named UserDomainGroups.
If the stored procedure has parameters, they must be separated by colons and the stored procedure parameter name and parameter value must be separated by a pipe (|).
Example:
<%SprocUserDomainGroups:MySproc:@parameter1|value1:@parameter2|value2|User Group: |%|S%>
The parameter name is SprocUserDomainGroups and the store procedure that will be called is MySproc. The stored procedure has 2 parameters, value1 and value2.
A report parameter may be defaulted to today's date as well as a number of days to or from today's date. To default a date parameter to the current date, the parameter name must start with DateToday. To set the default date x number of days before or after the current date, follow the DateToday parameter with a +X or -X where X is the number of days to add or subtract from the current date.
A parameter with the name of '<%DateToday-7|Activity Start Date: |12/24/2005|D%>' will show up as 11/24/2005 (given the current date of 12/1/2005) and '<%DateToday-0|Activity End Date: |12/31/2005|D%>' will show up as 12/1/2005 (given the current date of 12/1/2005). Notice that the report parameters default values are ignored when the DateToday parameter name is used.
Examples:
|
Control Type |
Name Property |
|---|---|
|
Label |
DateToday |
|
Label |
DateToday+3 |
|
Label |
DateToday-7 |
A report’s runtime parameters can be displayed on the report using a label control. Drag a label control onto the report design surface. Most often report parameters will be displayed on the report or page header section. The label's Name property must begin with "ParametersLabel”. For example, ParametersLabel or ParametersLabel1 may be used as the label name.
For the Report Parameters example above, the following label control are added to the report design surface with the defined properties.
| Control Type |
Name Property |
|---|---|
|
Label |
ParametersLabel |
All runtime parameters will be displayed at runtime within this control.

If a subreport uses parameters that are named exactly as the parent report's parameters, they name the sub reports' parameters, the parent report will pass the parameter values to the subreport.
To put a page number in either the group header or footer sections, place the following controls in the required section.
|
Control |
Name |
Text |
Properties |
|---|---|---|---|
|
Label |
lblPage |
Page |
|
|
Label |
lblOf |
Of |
|
|
Textbox |
txtPageNumber |
# |
SummaryType = PageCount |
|
Textbox |
txtPageCount |
## |
SummaryType = PageCount |
Note: The Names of the controls are arbitrary and can be named whatever is wanted.
Notice the Summary properties that are set for txtPageNumber and txtPageCount fields. The SummaryGroup property requires the name of the group header or footer section.

The above is how the fields will look on the report design surface.
To put a page number in either the group header or footer sections, place the following controls in the required section.
|
Control |
Name |
Text |
Miscellaneous |
|---|---|---|---|
|
Label |
lblPage |
Page |
|
|
Label |
lblOf |
Of |
|
|
Textbox |
txtPageNumber |
# |
SummaryType = PageCount |
|
Textbox |
txtPageCount |
## |
SummaryType = PageCount |
Notice the Summary properties that are set for txtPageNumber and txtPageCount fields. The SummaryGroup property does not need to be set in the case of a Page Header or Page Footer.

The above is how the fields will look on the report design surface.
The date and time the report is run can be displayed on the report, using a textbox control. Drag a textbox control onto the report design surface. Most often the report date/time stamp will be displayed on the report header section. The textbox's Name property must begin with "TimeStamp". Format the date/time stamp using the OutputFormat property.
For the Date/time stamp example above, the following textbox control are added to the report design surface with the defined properties.
|
Control |
Name |
Property |
|---|---|---|
|
Textbox |
TimeStamp |
OutputFormat = M/d/yyyy h:mm tt |
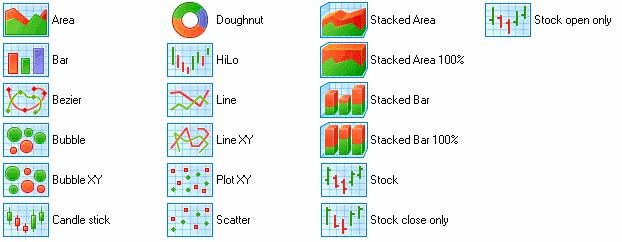
When adding a chart control to the report design surface, the chart wizard will automatically pop up. The chart wizard will allow the customization of the chart type, appearance, series, titles, axes, and the legend.
Select from 2D chart types:
or 3D chart types:
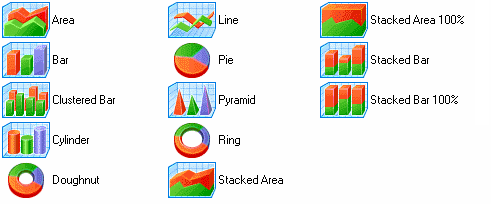
The following pages of the wizard allow the customization of the chart's appearance, color, titles etc. Press Finish to complete the customization of the chart. Once this is done, the chart may be customized at any time by right-clicking on the chart and selecting Wizard... or Customize... from the shortcut menu.
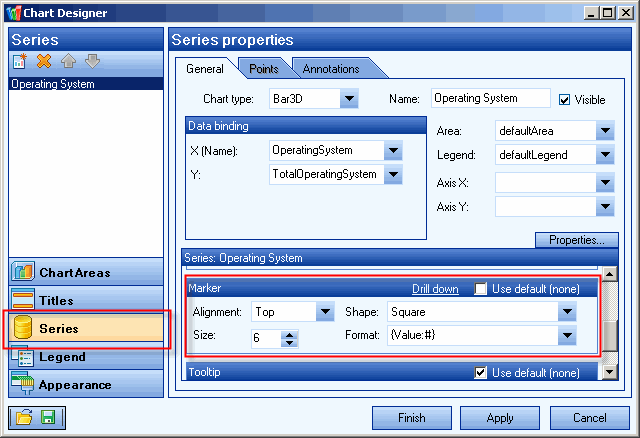
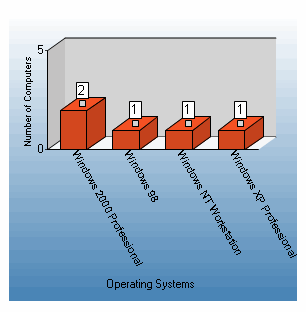
Markers are used to show the value of the data series in a chart. The marker value can be displayed as a point, square, circle, triangle, inverted triangle, diamond, period or cross. It may be aligned to various sections of the chart as well as colors and formats.
To add markers to a chart first add the chart control to the report. Right click on the report and choose customize from the context menu. The Chart Designer will display. Select the Series menu. In the series section of the dialog, scroll down to the marker section. Clear the Use default box. Set the appropriate alignment, shape, size and format.
Reports can contain any number of child reports by using the Subreport control. Child reports, or subreports, are executed each time the parent section (i.e. the section in which the Subreport control is placed) is printed.
Note: Subreports will not print PageHeader/Footer sections. These sections should be deleted on the Subreport to save on processing time.
The most important property to set when using a subreport control is the ReportName property in the data section. Set this to the exact name of the subreport. The size and position of the subreport control will determine how it get displayed at runtime. The DataField property on the subreport control can be set in order to send data to the subreport.
In the Desktop Authority pre-defined Desktop Hardware Inventory - Detailed report, there are several subreports. Let's look at one of them. The RAM (Bank Slot) section of the report contains a subreport control named SubReport1. This control's ReportName property is set to subRAM. Notice that the DataField property is set to Computer ID. What this does is calls the subRAM report and passes the value of the datafield, Computer ID, to the report.
The subreport subRAM uses the passed DataField value in the WHERE clause of its own SQL statement. It is represented as a parameter in the statement. See the Report Parameter section above for detailed information on coding the SQL statement for use with parameters.
WHERE
dbo.Hardware_SIMM.LastUpdated >= dbo.HardwareInventory.LastUpdated AND
dbo.HardwareInventory.ComputerIdentificationID = '<%Computer ID|Computer ID: |0|S%>'
The rest of the subreport is created just the same as any other report.
If a subreport uses parameters that are named exactly as the parent report parameters, they name the sub reports' parameters, the parent report will pass the parameter values to the subreport.
Summary fields can be added to any report section to calculate totals, counts, averages and other aggregations. Once the field is added to the report design surface the field's Summary properties can be set. The most common type of summary fields used in Desktop Authority reports are Counts and Sums. Find the steps for each type of summary field below.
To Count the number of items in a group, place a textbox field in the desired group header or footer. Set the OutputFormat property to the proper format. The most important properties are the Summary properties. This is what makes the field count and reset its value. Set the following properties:
SummaryFunc = Count
SummaryGroup = ghHeader
This is the name of the Group Header or Footer where the data is to be counted and displayed.
SummaryRunning = Group
Set to Group to count at the group level. This will reset the count for each group. Setting this property to All will force the count to keep incrementing following each group.
SummaryType = Sub Total
Set to Sub Total to reset the count for each group. Set to Grand total to count at the report level. Set to Page total to reset the count for each page.
To Sum fields within a group, place a textbox field in the desired group header or footer. Set the OutputFormat property to the proper format. The most important properties are the Summary properties. This is what makes the field sum and reset its value. Set the following properties:
DataField = the name of the field to sum
SummaryFunc = Sum
SummaryGroup = ghHeader
This is the name of the Group Header or Footer where the data is to be summed and displayed.
SummaryRunning = Group
Set to Group to sum at the group level. This will reset the sum for each group. Setting this property to All will force the sum to keep incrementing following each group.
SummaryType = Sub Total
Set to Sub Total to reset the sum for each group. Set to Grand total to sum at the report level. Set to Page total to reset the sum for each page.
In addition to Summary type fields, calculated fields can also be used in any report section. A calculated field is a field that performs calculations based on the value of specific data fields.
Using textbox controls, add the data fields to the report design surface. Set the calculation in the DataField property of the textbox control. All calculated fields will begin with an equal sign (=).
Ex. = [datafield1] + [datafield2]