Chatee ahora con Soporte
Chat con el soporte

Foglight 7.1.0 - User Guide

Changes to the Foglight User Interface

Foglight 7.1.0 introduces an updated user interface that improves navigation and search functions. Some legacy functions are not available in the new interface components. To access these functions, you must switch to the previous Foglight interface (refereed to as the Classic Foglight web console). When these functions are described in the sections below, a note will indicate that this step is necessary.

Refer to Opening the Foglight classic Web Console for more information.

Navigating Foglight

In addition to the links on the Welcome page, use the navigational aids described in the sections below to navigate Foglight.

TIP: Visit http://eDocs.quest.com to watch our learning videos. See Introduction to the Foglight User Interface.

Use the left-hand navigation panel to move between dashboards. This panel lists all dashboards that are available to you based on your roles. Expand a module and select a dashboard to view it in the display area (for example, Dashboards > Services > Service Levels). The navigation panel can be edited to show only the modules that interest you. You may search the navigation panel to show only dashboards matching the entered string.

Foglight remembers the state of the navigation panel between logins, so if you make changes to the navigation panel when you log out, those changes will persist the next time you log in.

Changing to the Classic Foglight web console

The name of the current dashboard is displayed in bold at the top of the dashboard, at the end of a path called the breadcrumb trail.

When you move directly from one dashboard to another, the names of the previous dashboards are displayed in a breadcrumb trail.

Use the links in the breadcrumb trail to return to previously-viewed dashboards in a workflow or series of drilldowns.

Use the graphical and text links in views to drill down to additional details that help you diagnose problems. Depending on the link, you drill down to a different dashboard or a smaller view called a popup that appears above the dashboard you are currently viewing.

You can drill down from many different parts of a view, including names of monitored components (such as hosts or services), the Explore links in a popup, and items like charts, tables, cylinders, and icons.

For example, in the My Services dashboard, click the icon will drill down further into the detailed information of that service.

Use bookmarks to keep track of dashboards and views that you want to revisit or access quickly, without having to drill down several levels. A bookmark can be a snapshot of data that is “frozen” at a specific point in time, or it can be updated with current data when you access it. For example, you could create a bookmark to quickly access the System Overview on a particular host from last Wednesday.

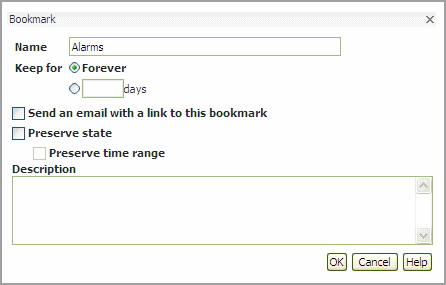
You create a bookmark by navigating to the dashboard you want to bookmark, selecting Bookmark from the action panel, and then selecting options from the Bookmark dialog box. See the online help for the Bookmark dialog box for details.

The bookmarks you create are listed in the Bookmarks section of the navigation panel. When you select a bookmark, it appears in the display area.

2
Select Email from the action panel. An email window opens, containing a link to the bookmark.
3
On the confirmation dialog, click Delete to delete the bookmark.

Opening a new window instead of using the current browser is useful, for example, when you want to open a link or print a document, such as a PDF. When you use a new window, the document downloads or prints in the background and you are prevented from accidentally closing the browser window when closing the PDF.

1
Click the New Window link in the action panel to open a new browser window and change the URL to create a sub-session.

Running a Report

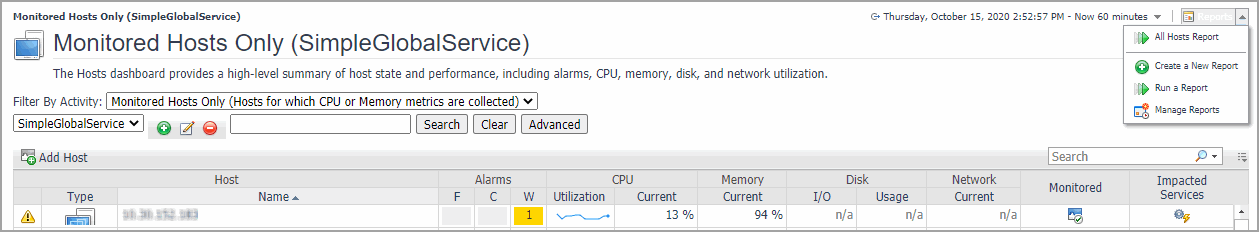
You can run, create, and manage your reports from any dashboard. The Reports menu is available on the top right corner of a dashboard. Some dashboards have an associated report template displayed at the top of this menu. For example, open the hosts dashboard. The All Hosts Report template is listed. In addition, if a user has created reports based on a dashboard and allowed your user role access to it, these reports are also listed in the Reports menu for that dashboard. For more information on reports, see Reporting on Your Enterprise .

Choosing a Home Page

You can choose any dashboard and make it your personal home page. Other dashboards can also be designated as home pages by a dashboard developer. These are listed under Homes in the navigation panel.

a
On the Foglight navigation menu, click the Open Foglight classic web console icon . The classic web console will open in a new tab.
3
Click Make this my home page in the action panel.
The dashboard is listed under Homes in the navigation panel and will be the first page that Foglight displays every time you log in.

If you later choose another dashboard as your home page, it replaces the previous one.

Documentos relacionados

The document was helpful.

Seleccionar calificación

I easily found the information I needed.

Seleccionar calificación