|
• |
|
• |
|
• |
|
Normal — can correspond to one of the following mirroring states:
NOTE: To view whether the mirroring operation is configured to use a Witness, click the Customizer button at the end of the table and turn on the display of the Witness Name and Witness State columns. For details, see Additional metrics in the Mirroring table.
Warning — can correspond to one of the following mirroring states:
Critical — can correspond to one of the following mirroring states:
| |
|
Clicking this field displays the Alarms list, which is listed by severity order. See the Foglight Online Help, Monitoring System-Wide Alarms for details on the alarm information. |
|
1 |
|
• |
|
• |
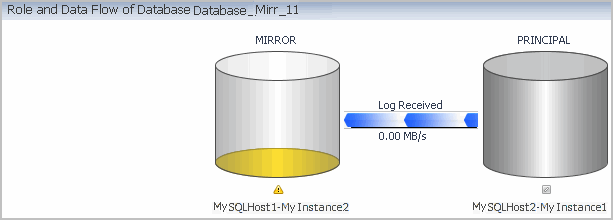
Click the link Investigate using the Partner’s Mirroring Page on the upper right side of the panel, above the table. |
|
• |
Principal Counters — this pane displays a chart of the following values, which can be selected from the list on the upper left: |
|
• |
|
• |
Mirror Counters — this pane displays a chart of the following values, which can be selected from the list on the upper left: |
|
• |
Clicking the link Investigate using the Partner’s Mirroring Page on the upper right side of the table. |
|
• |
|
• |
|
• |
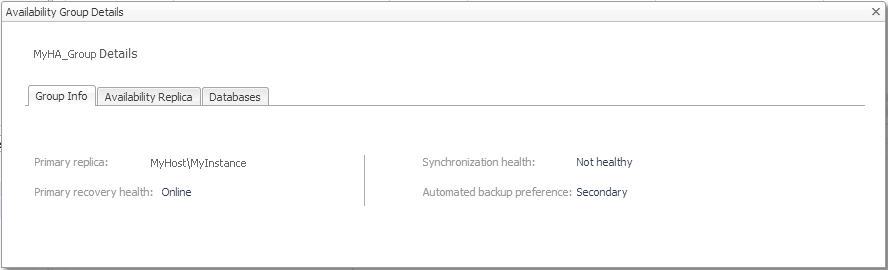
Explore — contains a shortcut icon which, when clicked, displays the Availability Group details pop-up. |
|
• |
|
• |
|
• |
|
• |
|
• |
|
• |
|
• |
|
• |
|
• |
