Chatee ahora con Soporte
Chat con el soporte

Foglight for Infrastructure 5.9.7 - User Guide

Using Foglight for Infrastructure Monitoring log files with Foglight Log Monitor Monitoring IBM PowerVM environments
Before you begin Managing PowerVM HMC agents Monitoring your PowerVM environment
Advanced system configuration and troubleshooting Reference
Foglight for Infrastructure views Foglight Log Monitor views Rules Metrics
Appendix: Building regular expressions in Foglight

Viewing individual PowerVM VIOS details

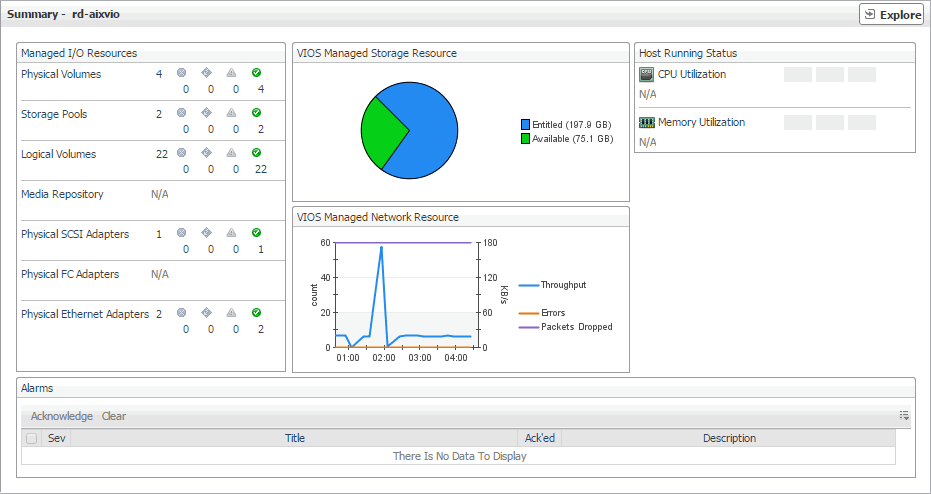
The VIOS Summary view displays the resource utilization for the selected PowerVM® VIOS. This view identifies the resource components managed by this VIOS, the levels of available and assigned disk resources, the network throughput rate and numbers of errors and dropped packets over the selected time range, and the trends in the host processor and memory utilization.

This view appears in the Selected Service PowerVM view when you select the VIOS tile, and then click a VIOS in the VIOS view on the left. Use it to review the trends in usage of the resources managed by the selected PowerVM VIOS, and to review any generated alarms, if they exist. For example, high peaks in the VIOS Managed Network Resource chart could indicate performance degradation and should be investigated.

Managed I/O Resources


Physical Volumes

The number of physical disks available to the PowerVM virtual I/O server, followed by the numbers of physical disks in each severity state: Normal , Warning , Critical , and Fatal .


Storage Pools

The number of storage pools available to the PowerVM virtual I/O server, followed by the numbers of storage pools in each severity state: Normal , Warning , Critical , and Fatal .


Logical Volumes

The number of logical disks available to the PowerVM virtual I/O server, followed by the numbers of logical disks in each severity state: Normal , Warning , Critical , and Fatal .


Media Repository

The number of media repositories available to the PowerVM virtual I/O server, followed by the numbers of media repositories in each severity state: Normal , Warning , Critical , and Fatal .


Physical SCSI Adapter

The number of physical SCSI (Small Computer System Interface) adapters available to the PowerVM virtual I/O server, followed by the numbers of physical SCSI adapters in each severity state: Normal , Warning , Critical , and Fatal .


Physical FC Adapter

The number of physical FC (fiber channel) adapters available to the PowerVM virtual I/O server, followed by the numbers of adapters in each severity state: Normal , Warning , Critical , and Fatal .


Physical Ethernet Adapter

The number of physical Ethernet adapters available to the PowerVM virtual I/O server, followed by the numbers of adapters in each severity state: Normal , Warning , Critical , and Fatal .

VIOS Managed Storage Resource


Entitled

The amount of disk space that is managed by the PowerVM VIOS.


Available

The amount of disk space that is managed by the PowerVM VIOS, and is available for entitlement to the associated PowerVM partitions, or for its own use.

VIOS Managed Network Resource


Throughput

The rate at which the PowerVM VIOS transfers data to and from the network during the selected time range.


Errors

The rate at which the PowerVM VIOS encounters errors while transferring data to and from the network during the selected time range.


Packets Dropped

The rate at which the PowerVM VIOS drops data packets while transferring data to and from the network during the selected time range. By default, network adapters send or receive multiple data packets in a single request. When data packets are dropped before reaching their destinations, this may indicate a problem with the network connection or the network adapters.

Host Running Status


CPU Utilization

The percentage of the allocated processor resources that the host associated with the PowerVM VIOS currently uses.


Memory Utilization

The percentage of the allocated memory resources that the host associated with the PowerVM VIOS currently uses.

Alarms

For more information, see Observing alarms.

Investigating additional managed server, partition, and VIOS details

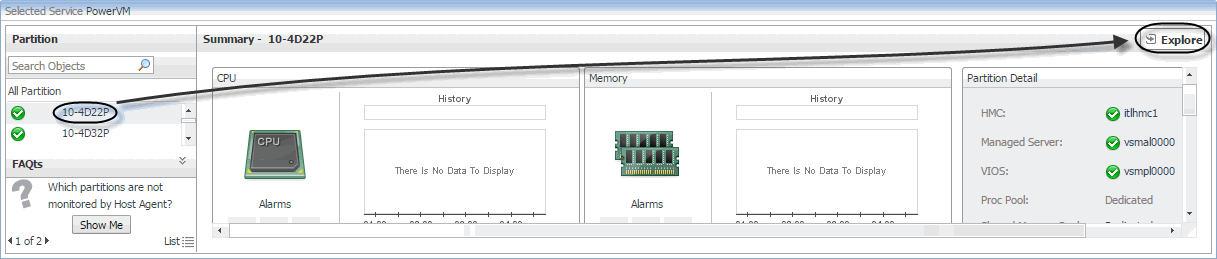
If you see any indicators that can potentially lead to performance degradation, you can explore managed servers, partitions, and virtual I/O servers in more detail to find out more information that can help you prevent service interruptions. To do that, select a desired managed server, partition, or virtual I/O server object, and click Explore in the top-right corner of the Selected Service PowerVM view.

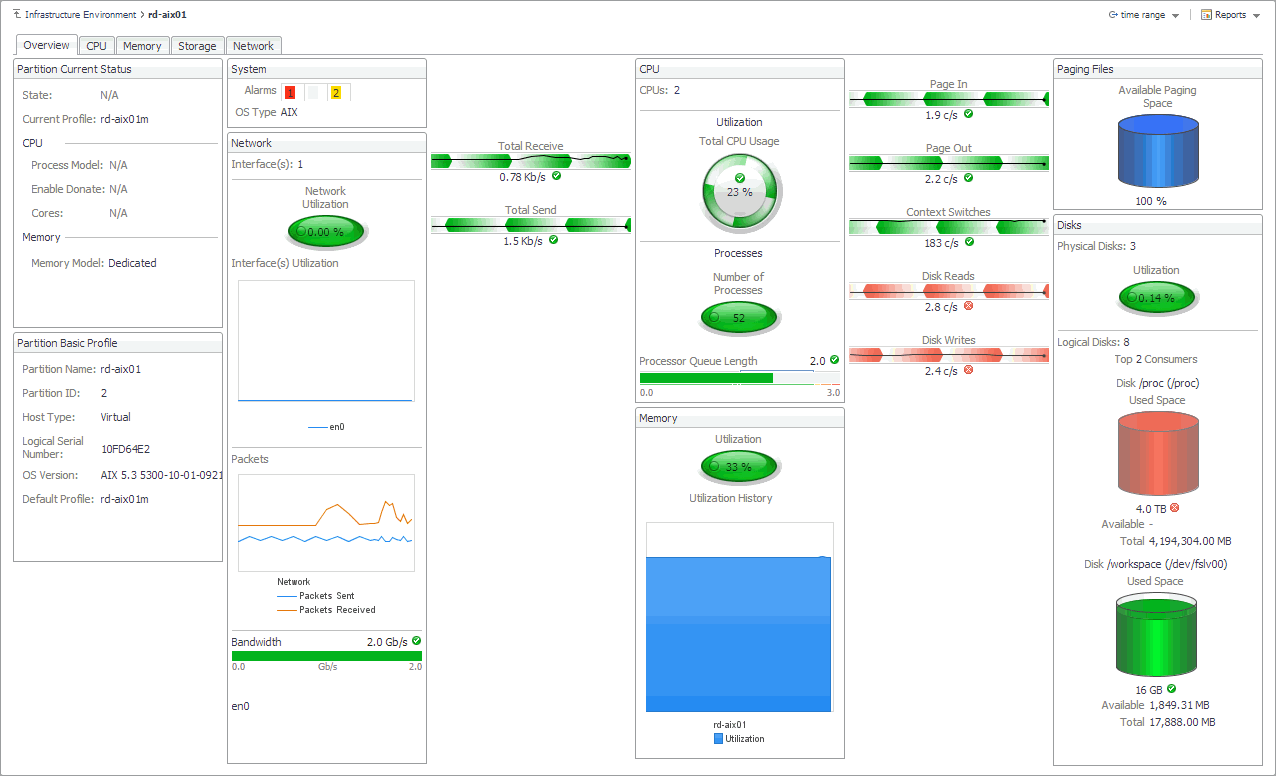
The type and extent of information appearing in the resulting Details view depends on the type of the selected object. For example, if you drill down on a PowerVM partition, the Details view consists of four tabs: Overview, CPU, Memory, Storage, and Network, each describing the relevant resource-related details.

Observe the information on these tabs when you want to understand the underlying cause of performance degradation. For example, unusually high values of memory usage can lead to system degradation and should be further investigated.

Exploring PowerVM partition and PowerVM VIOS overviews

The Overview tab appears open when you explore a PowerVM® partition or a PowerVM VIOS for the first time. It displays the state of the partition's processor, memory, disk, and network resources. These visual elements are connected with graphical flows that illustrate the flow of data in real time. For example, you can review the rates of incoming and outgoing network data.

To navigate to this tab, in the Selected Service PowerVM, select a PowerVM partition or a PowerVM VIOS, and click Explore.

The running state of the PowerVM Partition or VIOS. Possible values include: Not Activated, Starting, Running, Shutting Down, Error, Open Firmware, Not Available.

The name of the currently used PowerVM Partition or VIOS profile. A profile specifies how many processors, how much memory, and which I/O devices and slots are to be allocated to the partition. A PowerVM Partition or VIOS can have multiple profiles.

The process model of the PowerVM Partition or VIOS. There are two types of processing modes: Shared and Dedicated. Shared mode allows assigning partial processor units from the shared processor pool. Dedicated mode indicates that all processor units can be assigned to one PowerVM partition or VIOS, for its own use.

Indicates if the PowerVM Partition or VIOS can donate spare processor cycles to the shared pool.

The number of threads the PowerVM Partition or VIOS uses.

The memory model the PowerVM Partition or VIOS uses: Dedicated or Shared.

The name of the PowerVM Partition or VIOS

The ID of the PowerVM Partition or VIOS object in your monitored system.

The type of the system host on which the PowerVM Partition or VIOS object is running: Virtual or Physical.

The serial number of the PowerVM Partition or VIOS.

The OS name and version running on the PowerVM Partition or VIOS.

The default PowerVM Partition or VIOS profile, indicating how resources are assigned to that component (selected or all resources). If the current profile does not exist, the system loads this default profile. A profile specifies how many processors, how much memory, and which I/O devices and slots are to be allocated to the partition. A PowerVM Partition or VIOS can have multiple profiles.

NOTE: For information about the other views also appearing in PowerVM Partition Details view, see the Foglight User Guide.

Exploring managed server profiles

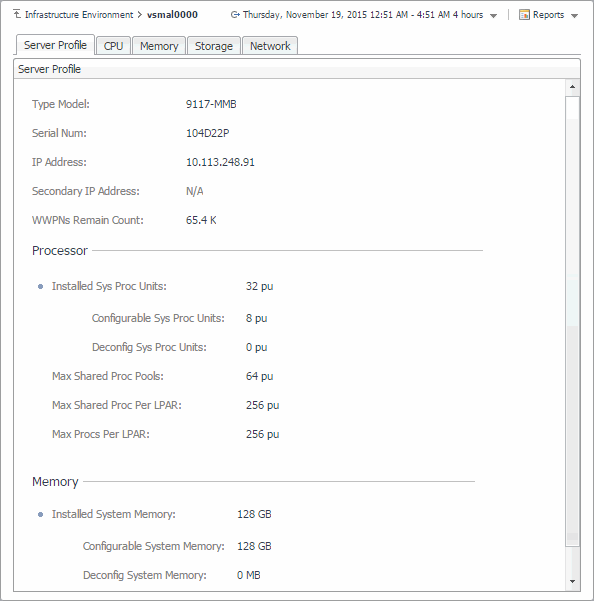
The Server Profile tab appearing on the managed server view displays system configuration information about the selected managed server. Use it to find out the overall capacity of the physical system hosting multiple logical partitions.

To navigate to this tab, in the Selected Service PowerVM view, select a managed server, and click Explore.

Figure 28. Server Profile tab

The managed server model number.

The managed server serial number.

The primary IP address of the managed server in your monitored environment.

The secondary IP address of the managed server.

The remaining number of world wide port names (WWPNs).

The number of processor units allocated to the managed server.

The number of processor units that can be allocated to the shared processor pool and reallocated to PowerVM partitions associated with the managed server.

The number of processor units that cannot be allocated to the shared processor pool.

The maximum number of shared processor pools associated with the managed server.

The maximum number of shared processor units allocated to each PowerVM partition associated with the managed server.

The maximum number of processor units allocated to each PowerVM partition associated with the managed server.

The amount of system memory allocated to this managed server.

The portion of system memory that can be allocated to the shared memory pool and reallocated to PowerVM partitions associated with the managed server.

The portion of system memory that cannot be allocated to the shared memory pool.

Documentos relacionados

The document was helpful.

Seleccionar calificación

I easily found the information I needed.

Seleccionar calificación