Description of embedded views
This dashboard is made up of the following embedded views:
|
This view displays how the CPU resources are being used based on the following: | |||||||||
|
|
This view displays how the memory resources are being used based on the following: | |||||||||
|
|
|
Foglight Log Monitor views
Foglight Log Monitor allows you to monitor and configure your virtual environment. For more information about the Log Monitor dashboard, see Investigating log records.
The Log Monitor dashboard contains the following views:
File Selector view
The File Selector view allows you to select a log. You have an option to select a file log monitored by the File Log Monitor Agent, or a Windows Event Log, monitored by the Windows Event Log Monitor Agent.
|
Log Records view
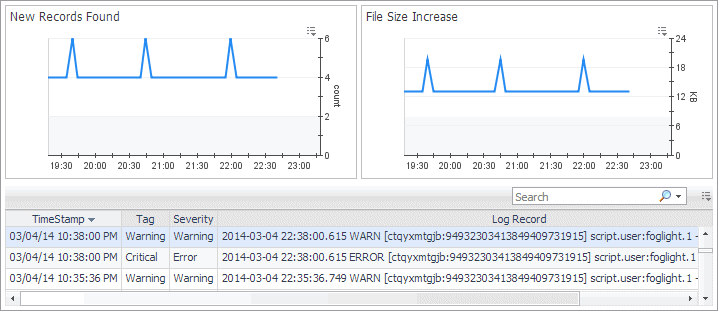
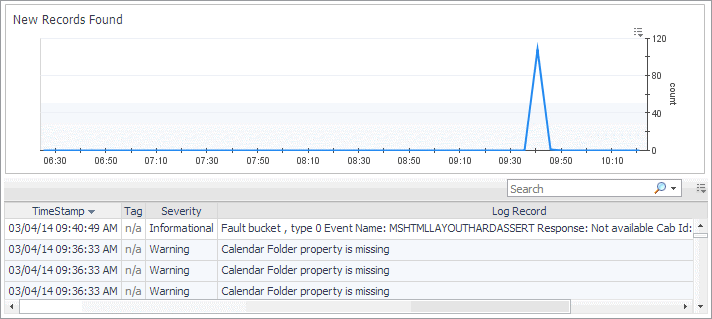
The Log Records view lists the records available in the selected log and shows the growth of log records over time. Use this view to review the contents of your logs, and look for signs that indicate potential issues. The layout of this view depends on the selected log type.
This view is made up of the following embedded views:
|
Shows the increase in the size of the monitored log file over the selected time range. |
| |||
| |||
| |||
|


