|
NOTE: The Administration dashboard can be accessed only when the users have both the Administrator role and the Container Administrator role. To grant the users with the Container Administrator role, go to Administration > Users & Security management under Administer Server > Manage Users, Groups, Roles > Roles tab. |
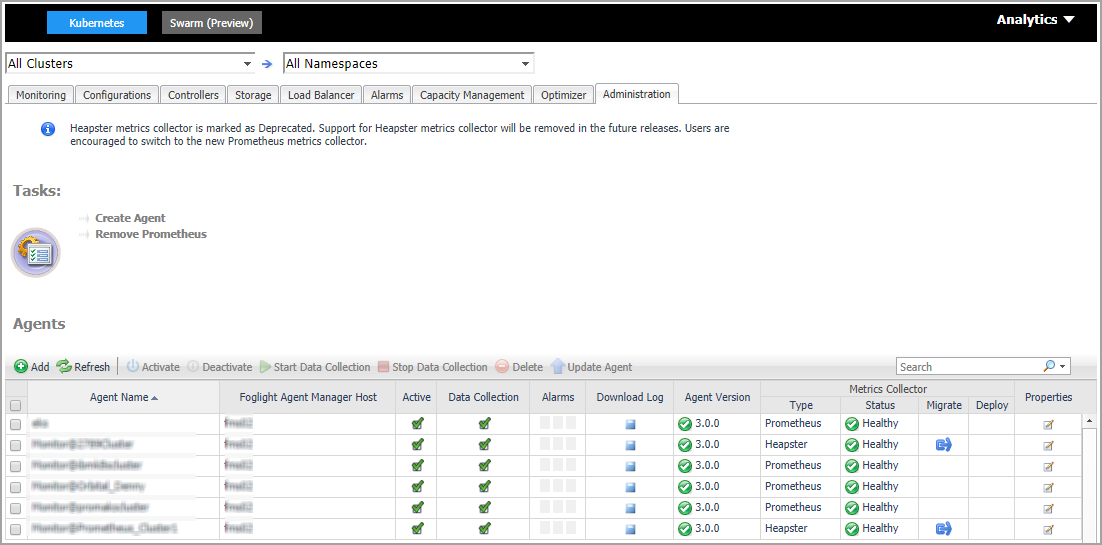
The Administration dashboard supports new agent creation and existing agents management. It contains the following features:
Use Create Agent or the Add button to start a wizard to create a new agent. See Creating and Activating a Kubernetes Agent for more information.
Remove Prometheus will start a wizard to remove the Prometheus successfully deployed through our platform.
Select the Prometheus you want to remove and click Remove.
If the Prometheus service is deleted successfully, a result message will be display. Otherwise, the Remove Prometheus wizard will appear again with error messages to guide you with further operations. Follow the messages and delete them again later.
Use Activate, Deactivate, Start Data Collection, Stop Data Collection, Delete, and Update Agent to manage the agent.
|
• |
Type: the type of Metrics Collector, supports Heapster or Prometheus. |
|
• |
|
• |
Discover failed: failed to discover the Kubernetes service in your cluster. The Deploy |
|
• |
Migrate |
|
• |
Deploy |
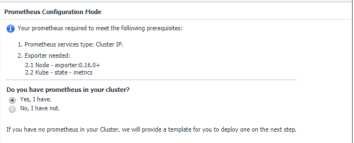
Clicking Migrate or Deploy
will launch the Configure Prometheus Metrics Collector Wizard.

|
NOTE: Whenever you change the content in Configure file (template), ensure that the Namespace and Name fields are consistent with the Prometheus service configurations in your Configure file (template). If you are using the default template, there is need to change anything. |

|
• |
If deployed successfully, a succeeded message will be displayed. Close the Validation Result page and then click Next to finish your agent creation process. |
|
• |
If failed to deploy the Prometheus configuration, a Validation Result page will be displayed with possible solutions. |
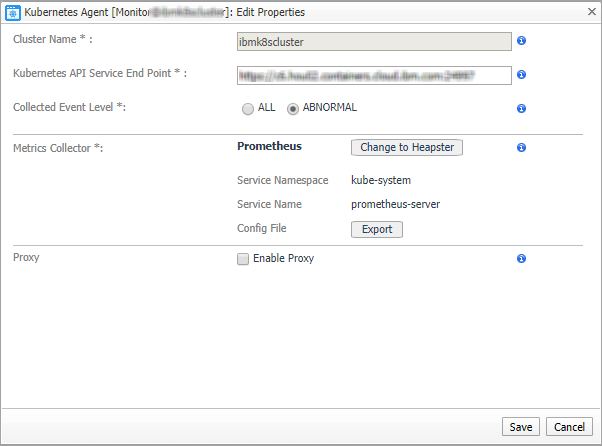
Click in Properties column of the Agents table to edit the property of the agent.

|
NOTE: If the Prometheus is deployed through our platform, the Service Namespace and Service Name cannot be updated through Kubernetes Agent Edit Properties wizard. You can use Remove Prometheus to remove Prometheus and deploy a new one. |

|
NOTE: If you are using your existing Prometheus as Metrics Collector, we will not help you to manage your Prometheus. Both the Service Namespace and Service Name can be updated in Kubernetes Agent Edit Properties wizard. |
The Docker Container Quick View appears after clicking Monitoring > Containers. Click Swarm (Preview) from the header on top to switch to Docker Swarm dashboard.
This view consists of the following two panes:
|
• |
The Docker Containers tree view, which appears on the left of Docker Containers Quick View, lists the containers existing in the monitored Docker environment. The containers in the tree view are grouped by cluster > docker host > container. |
|
• |
The Docker Container Summary view, which appears on the right after you select an individual container in the Docker Containers tree view. |
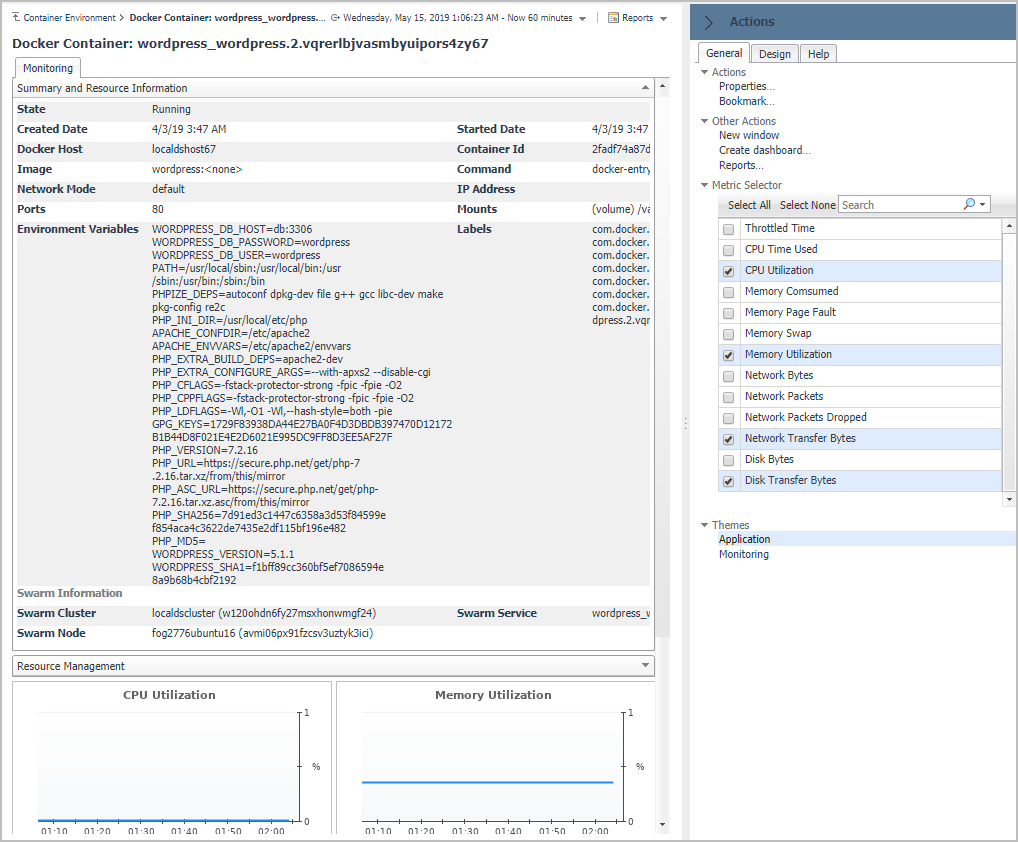
The Docker Container Summary view appears on the right when you select a container in the Docker Containers tree view.
The Docker Container Summary view displays the following data:
|
• |
|
• |
Resource Utilizations: The resource utilization for the selected Docker Container over a selected period of time, which includes the following: |
|
• |
CPU Load: Shows the CPU utilization of the selected container. |
|
• |
Network Transfer: Shows the transfer bytes rate of the selected container over a selected period of time. |
|
• |
Memory: Shows the memory utilization of the selected container. |
|
• |
Disk Transfer: Shows the disk transfer bytes rate of the selected container over a selected period of time. |
|
• |
Summary and Resource Information: Displays the detailed information about the selected Container, including State, Command, Created Time, Started Time, Image, and so on. |
Click Explore on the upper right of the Docker Container Summary view to open the Container Explorer view, which shows more detailed information about this container.
The Container Explorer view opens when you click Explore in the Docker Container Summary view, which includes the following tabs: