Storage Capacity tab
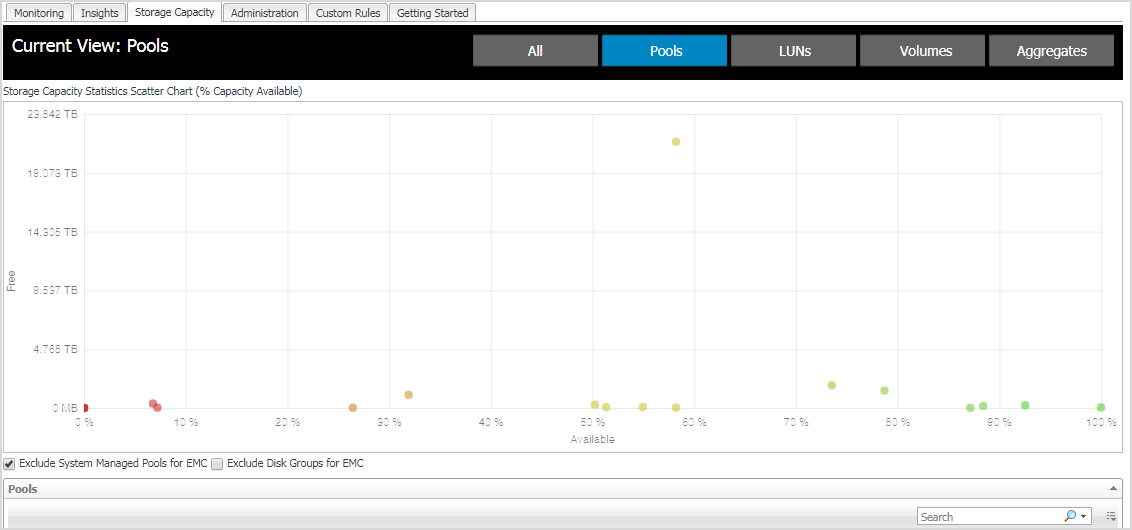
The Storage Capacity tab includes charts and tables for monitoring the capacity being used by the all devices, pools, LUNs, NASVolumes, or aggregates. Select what you want to monitor by clicking one of the following button at the top of the view: All, Pools, LUNs, Volumes, or Aggregates.
|
Health score. For details about how health scores are calculated, see Pool and Volumes health scores. | |
Health scores are base on two criteria:
If long term (preferred) or short term predictive data is available, the starting score is reset:
> 300 days to full: set to 100%
> 200 days to full: set to 85%
> 100 days to full: set to 70%
Any computed values over 100 are changed to 100%.
Any computed values < 0 are changed to 0%.
Any computed values over 100 are changed to 100%.
Any computed values < 0 are changed to 0%.
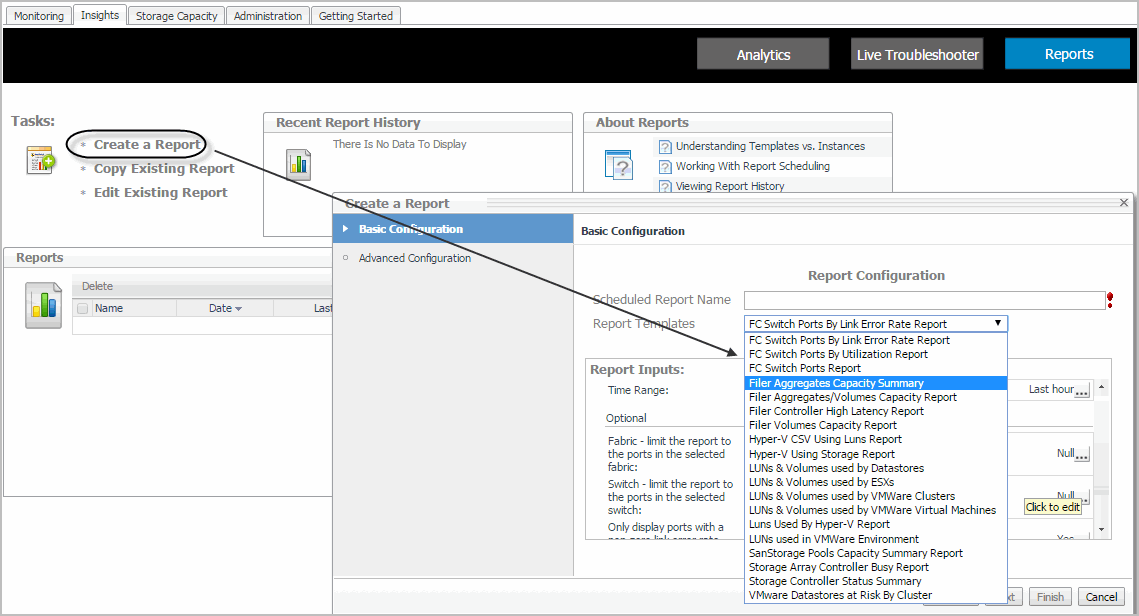
Creating Storage Reports
|
1 |
|
2 |
Click Finish to generate the report. |
Investigating Storage Devices
This section covers the following topics:
Introducing the Storage Explorer
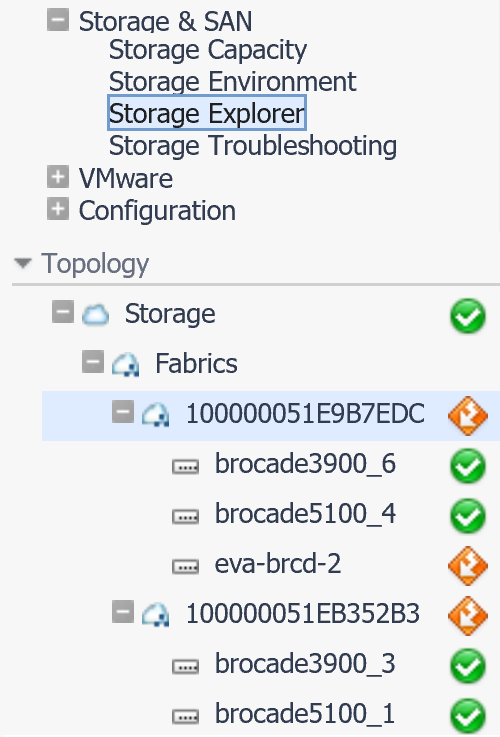
This walkthrough describes how to open the Storage Explorer and select a storage device. If you select a top-level device type node, such as Fabrics, the Storage Environment quick view is displayed. For more information about the quick view, see Monitoring Your Storage Environment.
|
1 |
|
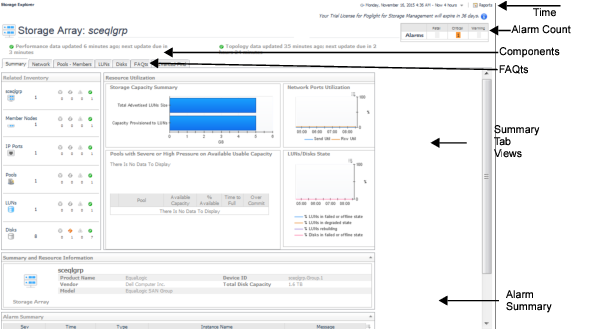
Displays counts of all the alarms at each severity level that are still active (not cleared) at the end of the displayed time range. Unlike the Alarm Summary view, the Alarm Count includes alarms for the device and all its child components. Click an alarm count to display the alarms at that severity level. | |||
|
When the Summary tab is selected:
| |||
|
When a component tab is selected:
| |||
|
Contains questions appropriate for the selected device type. For information on how to use a FAQts tab, see Asking Questions About the Monitored Storage Environment. | |||


