Chatee ahora con Soporte
Chat con el soporte

Foglight for Sybase 5.7.5.40 - User and Reference Guide

Using Foglight for Sybase
Exploring the Sybase Dashboards About the Sybase_MDA Agent About the Sybase_RS Agent Generating SybaseMDA Reports
Reference About us

Investigating Latency

Previous Next


Investigating Latency

The Foglight Cartridge for Sybase assists your investigation into latency with the RS_LatencyTabular table view and the RS_Latency_Graph view.

Latency is how long a transaction takes from being committed on the Primary Server to being committed on the Replicated Data Server. Foglight connects to each replicated server controlled by the monitored Replication Server. Foglight retrieves the latency time from each Replicated database for each Primary site for the last committed transaction from that site and returns this information to Foglight.

If a transaction from that Primary site has not been committed in more than 24 hours, and if the last commit time for that transaction is earlier than the last poll cycle of the Foglight agent, this transaction is marked as .stale. information for that Primary site.

Foglight needs to be able to connect to each Replicated Server to collect this information. In addition, Foglight needs to be able to connect to each Primary server in order to determine the time zone factor when calculating the latency times.

To start with the RS_Latency_Tabular table view:
Open the RS_LatencyTabular table view to display the Replication Server’s latency information in a table format. There should be one row for each Primary database -Replicate database combination found in each Replicate Database that the monitored Replication Server connects to directly.
To view more detailed information:

Generating SybaseMDA Reports

Previous Next


Using Foglight for Sybase > Generating SybaseMDA Reports

Generating SybaseMDA Reports

Foglight for Sybase Foglight for Sybase includes a report generation and scheduling ability. This allows you to create reports using a set of predefined templates to report on the various aspects of your database environment. For more information about reports in Foglight for Sybase, how to generate and view them using the browser interface, see the Foglight for SybaseUser Help.

In general, all SybaseMDA reports begin with a summary page that shows overall statistics appearing in a combination of bar gauge and time plot charts. The summary page is followed by a graph showing the performance of a system wait event class and a list of the related events that occur during the selected time range.

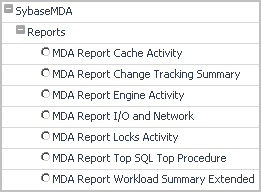
The Foglight for Sybase report templates can be found in the following location, when listed by module: SybaseMDA >Reports.

Figure 49. Reports

The cartridge comes equipped with the following report templates:

Cache Activity Report

Previous Next


Cache Activity Report

The Cache Activity report contains details about the data and procedure cache metrics monitored by a selected SybaseMDA agent for a given time range. It contains the following sections:

Cache Activity Summary shows the cache activity represented by the related metrics in bar charts. This section contains the number of named data caches, their total size, the size of the procedure cache, the maximum available memory, the available physical memory, and the data and procedure cache hit rates. The Data Cache and Procedure Cache hit rates show hit rate averages for the selected time period, along with the related severity level. Different-colored vertical lines in the graphs indicate threshold levels.
Waiting for a memory or buffer summary displays a graph that shows average wait times per sample for a specific class, and a table that lists all the events related to that class that occur during the selected time range.
Cache Graphs Summary contains graphs that indicate the data cache hit rate average, hits, misses and dirty buffers, as well as the procedure cache hit rate average, requests, loads, and writes.
Metrics Statistics Summary shows the a table listing the metrics related to the cache activity. For each metric, the table shows their previous and current values, the baseline minimum and maximum values, and the deviation of the current value from the baseline. The current values appear in bold text for better visibility. Metric groups appear in alternate text color for the same reason.
Data Cache Details show the metrics for each named cache, such as the size in MB, average hit rate, and others.
Data Pools Details show the various metrics for each pool in cache, such as the I/O size, pool size, and others.

Change Tracking Summary Report

Previous Next


Using Foglight for Sybase > Generating SybaseMDA Reports > Change Tracking Summary Report

Change Tracking Summary Report

The Change Tracking Summary report helps you understand the impact of various changes on the Sybase Server during a given time range. The report shows two periods: one before the change and one after the change. It shows this information in graph and table form. The cartridge can become aware of changes in any of the following ways:


This report takes two special input parameters:

stepMinutes: Set this parameter to the period of time in minutes that passes before and after the
beforeAfterMinutes: Set this parameter to the offset in minutes from the change time. This value is very important because it can eliminate a possible negative impact of the retention policy cycle in case the change happens in the middle of retention policy period. In this case, the period average is calculated using the values from the opposite sides of the change. The default retention policy period is 15 min. For example:

The change occurs at 10:00. stepMinutes is set to 15 and beforeAfterMinutes is set to 10 minutes. As a result, two periods appear: 9:35-9:50 and 10:10-10:25.

The report contains a table of contents and sections listed below. In addition to the list of the reports sections, the table of contents also shows all change events that occurred during the selected time period.

Instance Information shows the information about the selected database server, such as its health, user connections, engine, cache, databases running, and others.
Change Tracking Events Compare Graphs list all changes and contain several graphs. The first graph displays the count of changes over time, while the second graph shows the wait events which shows the impact of the changes on the monitored system. For example, an index creation change can help reduce the wait events in general. Other graphs in this section also illustrate how the changes affect the system, such as their impact on the engine and IO activity, and others.
Important Metrics Statistics Summary lists various metrics, grouped into several collections, such as Engines, Processes, SQLs. For each metric, it gives its value before the change and after the change, along with the respective baseline values for the period after the change. It can help understand the impact of one metric change on another. For example, a dramatic decrease in cache misses can be caused by an increased use of APF reads.
System Wait Classes Compare shows in list form the wait classes for the period before the change and after.
System Wait Events shows in list form the system wait events for the period before the change and after.
Change Tracking Events Details Compare contains additional details about the change tracking events.
Documentos relacionados

The document was helpful.

Seleccionar calificación

I easily found the information I needed.

Seleccionar calificación