Replication Server Metrics
 |
 |
Replication Server Metrics
There are multiple sections in the Replication Server pane:
The pane title line indicates the overall status of the replication server, which is either:
Primary Server - Replicated Server Status
The top sections show sets of related primary and replicated server information:
Click the Pop Up Screen button to see the full list of replicated server databases.
Primary Server Information
Replicated Servers Table
Partitions
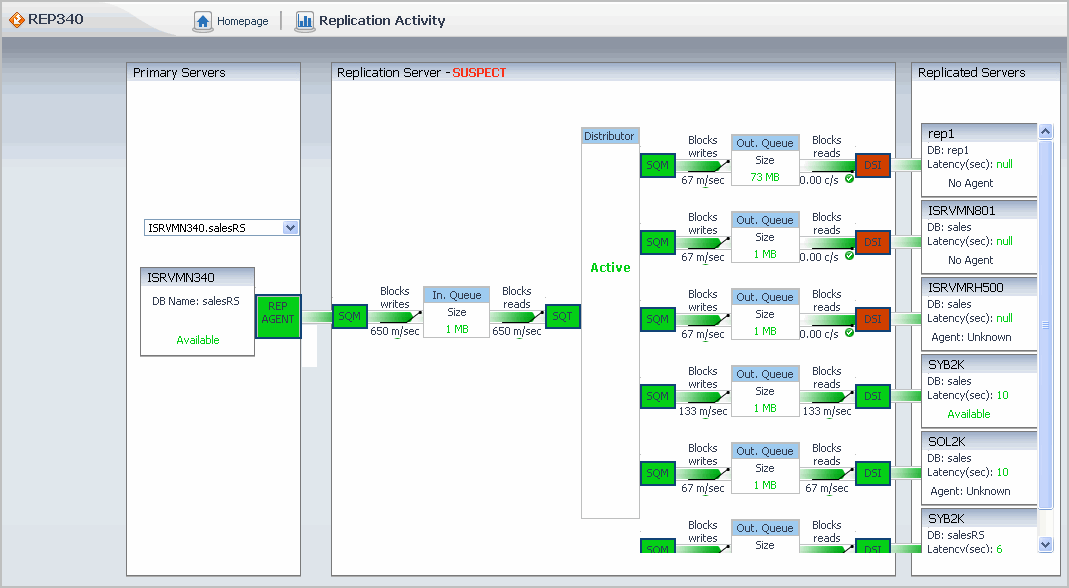
Replication Server Activity Dashboard
 |
 |
Replication Server Activity Dashboard
To display this dashboard, on the Sybase MDA Global View Dashboard, drill down on a Sybase_RS agent, and on the RS Home Page Dashboard that appears, click Rep Server Activity.
The dashboard contains the following sections:
Drilldown dashboards may be accessed through some of the dashboard element metrics.
Figure 38. Replication Server Activity Dashboard
Primary Servers Metrics
 |
 |
Primary Servers Metrics
Table 65. Primary Servers Metrics
Shows the database name and the status of the Sybase_MDA Agent. The status of the Sybase_MDA agent:
You can drill down by clicking on this status field. The MDA Home Page Dashboard appears for the appropriate server.
Replication Server Metrics
 |
 |
Replication Server Metrics
The pane title line indicates the overall status of the replication server, which is either:
Table 66. Replication Table Metrics
The status of the DSI thread that is associated with a replicated server.

