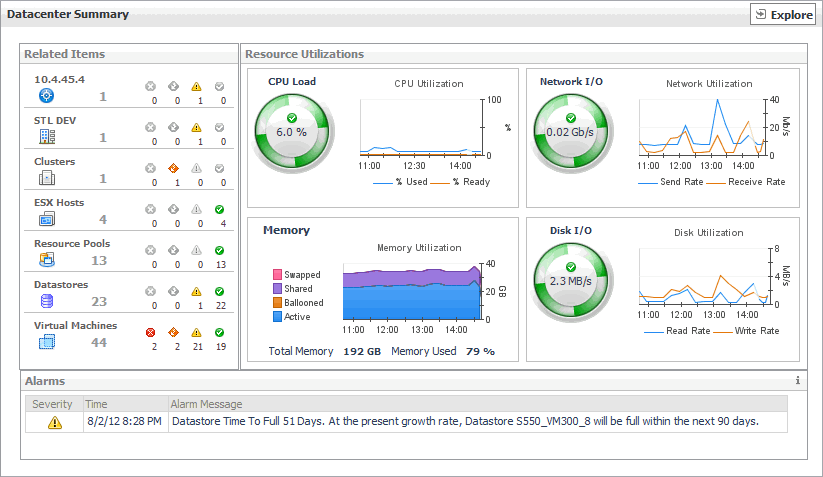
The Datacenter Summary view shows the overall resource utilization and the amounts of system resource consumption for a datacenter.
|
1 |
On the VMware Environment dashboard, on the Monitoring tab, in the Virtual Environment Overview, select the Servers tile. |
|
2 |
This view is made up of the following embedded views:
|
• |
| |||
| |||
| |||
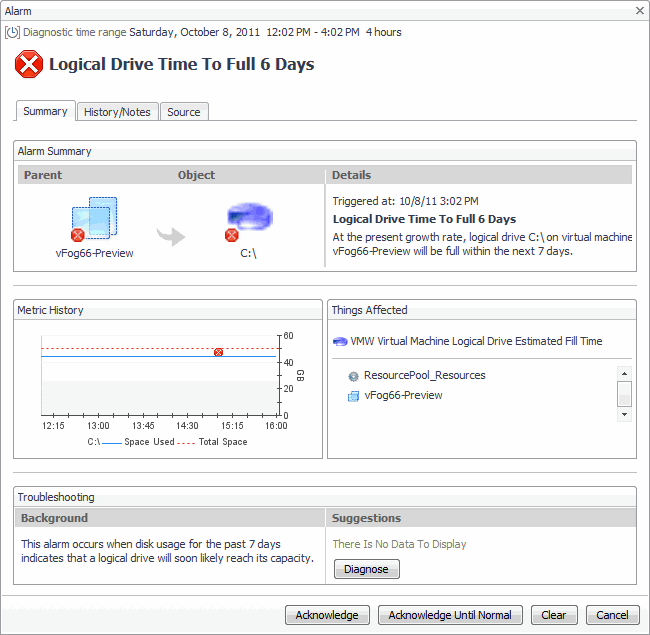
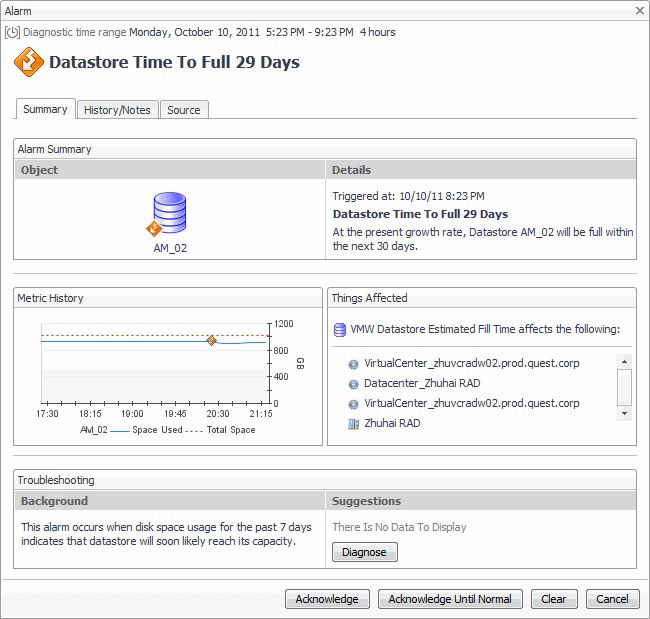
Figure 253. Alarms dialog box
 |
| |||
| |||
| |||
| |||
| |||
| |||
| |||
Figure 254. Alarms dialog box
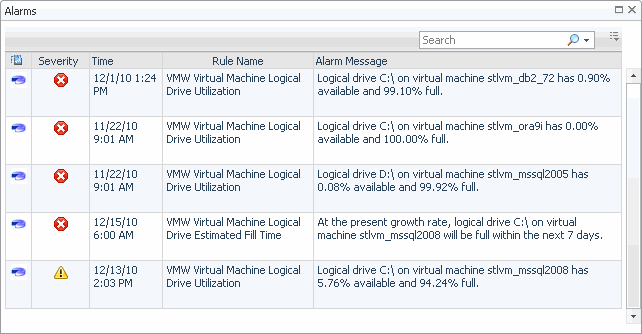 | |||
Figure 255. Clusters Inventory dwell
 | |||
Figure 256. Datacenters Inventory dwell
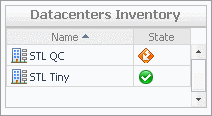 | |||
Figure 257. Datastores Inventory dwell
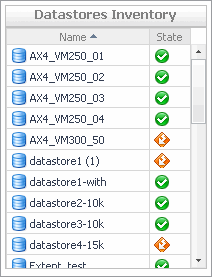 | |||
Figure 258. ESX Hosts Inventory dwell
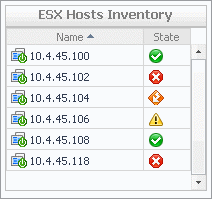 | |||
Figure 259. Resource Pools Inventory dwell
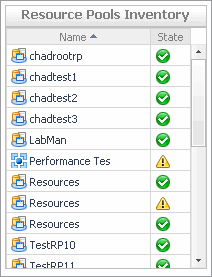 | |||
Figure 260. Virtual Centers Inventory dwell
| |||
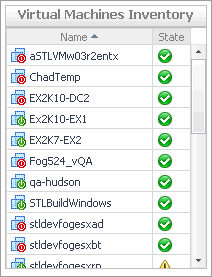
Figure 261. Virtual Machines Inventory dwell
 |
|
Shows the resource consumption for the selected datacenter broken down into four simple views. | |||
| |||
| |||
| |||
| |||
| |||
| |||
| |||
| |||
| |||
| |||
| |||
| |||
| |||
Figure 262. CPU Load dialog box
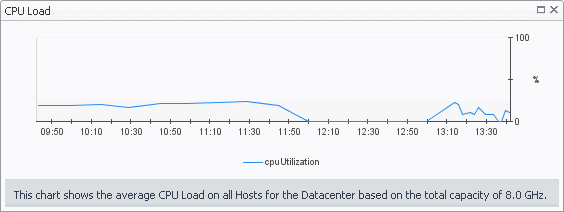 | |||
Figure 263. CPU Utilization dialog box
 | |||
Figure 264. Disk I/O dialog box
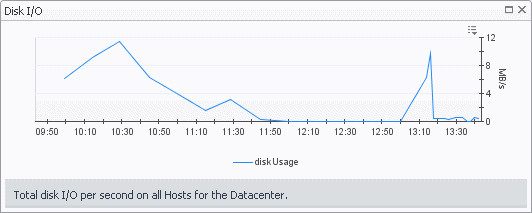 | |||
Figure 265. Disk Utilization dialog box
 | |||
Figure 266. Memory Utilization dialog box
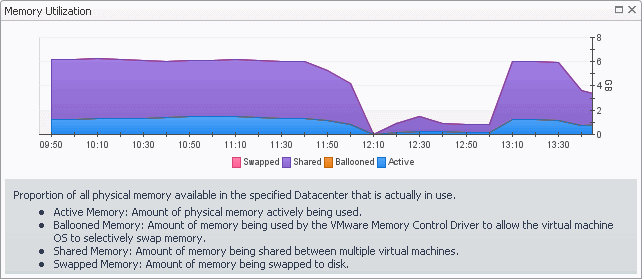 | |||
Figure 267. Network I/O dialog box
 | |||
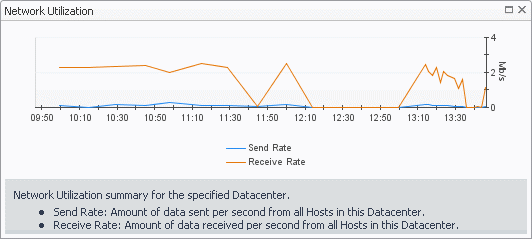
Figure 268. Network Utilization dialog box
 |
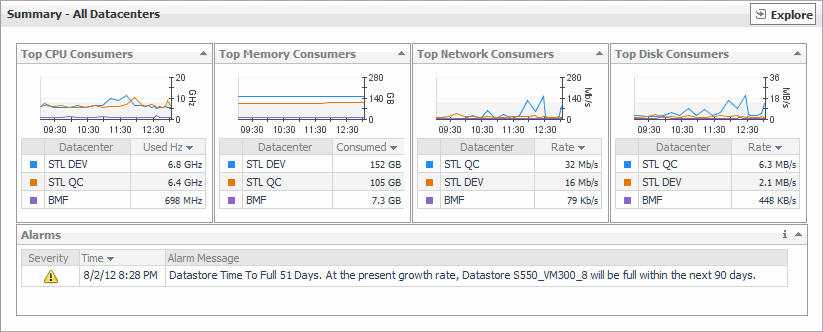
The Summary - All Datacenters view displays overall resource utilization information for a group of datacenters and shows the elements that consume the highest amount of system resources.
|
1 |
On the VMware Environment dashboard, on the Monitoring tab, in the Virtual Environment Overview, select the Datacenters tile. |
|
2 |
This view is made up of the following embedded views:
|
• |
| |||
| |||
| |||
| |||
Figure 270. Alarm Created dialog box
 |
|
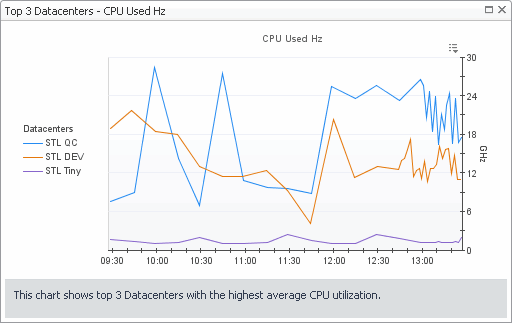
Shows the top three datacenters with the highest average CPU utilization. | |||
| |||
| |||
Figure 271. Top Datacenters -CPU Used Hz dialog box
 |
|
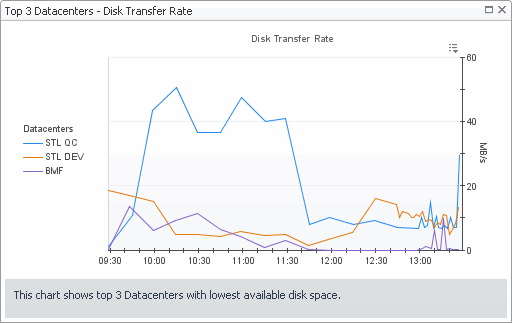
Shows the top three datacenters with the lowest available disk space. | |||
| |||
| |||
Figure 272. Top Datacenters - Disk Transfer Rate dialog box
 | |||
|
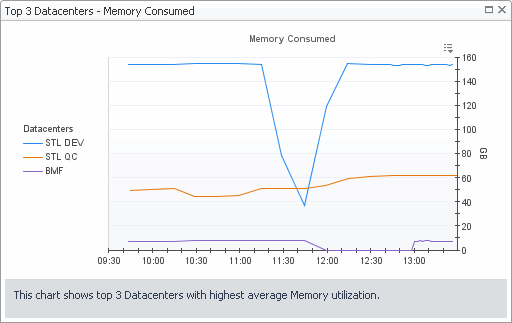
Shows the top three datacenters with the highest average memory utilization. | |||
| |||
| |||
Figure 273. Top Datacenters - Memory Consumed dialog box
 | |||
|
Shows the top three datacenters that are consuming most network bandwidth. | |||
| |||
| |||
Figure 274. Top Datacenters - Network Transfer Rate dialog box
 | |||
|
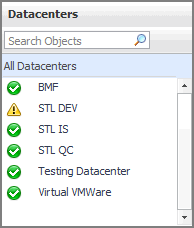
This tree view lists the datacenters that exist in your environment and shows their state.
Selecting All Datacenters displays overall resource utilization for all datacenters in your integrated system, and the elements that consume the highest amount of system resources in the Summary - All Datacenters view on the right. Similarly, selecting a datacenter node shows datacenter-specific metrics in the Datacenter Summary view on the right.
|
• |
On the VMware Environment dashboard, on the Monitoring tab, in the Virtual Environment Overview, select the Datacenters tile. |
| |||
| |||
| |||
| |||
|
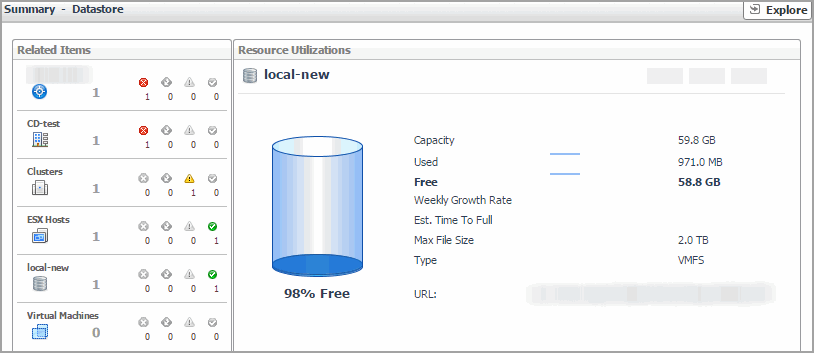
The Summary - Datastore view shows the overall resource utilization and the amounts of system resource consumption for a physical datastore.
|
1 |
On the VMware Environment dashboard, on the Monitoring tab, in the Virtual Environment Overview, select the Datastores tile. |
|
2 |
This view is made up of the following embedded views:
|
• |
| |||
| |||
| |||
Figure 277. Alarm dialog box
|
| |||
| |||
| |||
| |||
| |||
| |||
Figure 278. Alarms dialog box
| |||
Figure 279. Clusters Inventory dwell
| |||
Figure 280. Datacenters Inventory dwell
| |||
Figure 281. Datastores Inventory dwell
| |||
Figure 282. Virtual Centers Inventory dwell
| |||
Figure 283. Virtual Machines Inventory dwell
|
|
Shows the resource consumption for the selected datastore broken down into four simple views. | |||
| |||
| |||
| |||
| |||
| |||
| |||
| |||
| |||
| |||
| |||
Figure 284. Storage Used dialog box
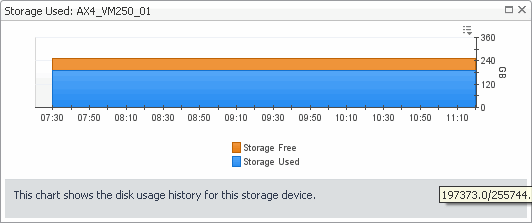 | |||
Figure 285. Logical Drive Utilization dialog box
 |