Datacenter Summary view
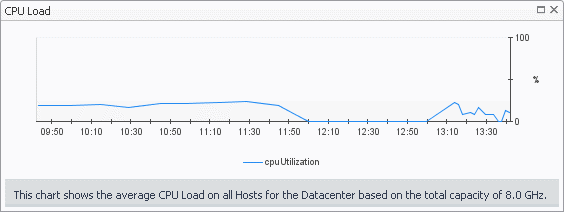
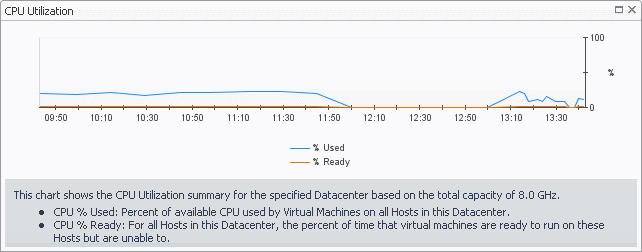
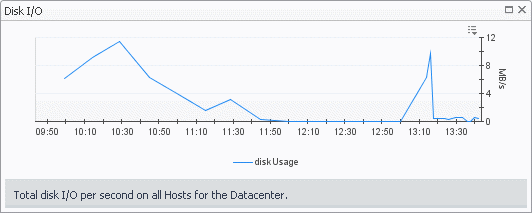
The Datacenter Summary view shows the overall resource utilization and the amounts of system resource consumption for a datacenter.
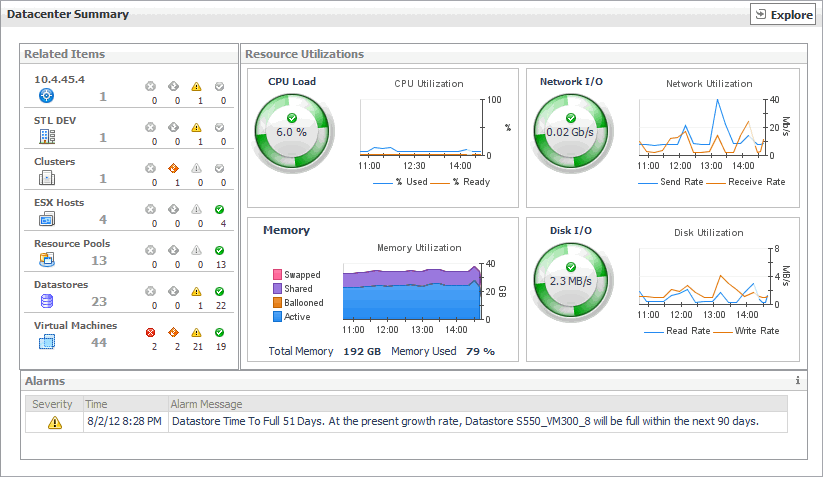
The Datacenter Summary view appears on the right.
This view is made up of the following embedded views:
|
|
Shows the numbers of the components that are associated with the selected datacenter and the related alarm counts. |
|
|
|
• |
Clusters. The number of clusters that are associated with the selected datacenter, followed by the related alarm counts. | |
|
|
|
|
|
|
• |
Datastores. The number of datastores that are associated with the selected datacenter, followed by the related alarm counts. | |
|
|
|
• |
ESX Hosts. The number of ESX hosts that are associated with the selected datacenter, followed by the related alarm counts. | |
|
|
|
• |
Resource Pools. The number of resource pools that are associated with the selected datacenter, followed by the related alarm counts. | |
|
|
|
• |
Virtual Center. The name of the virtual center to which the selected datacenter belongs, followed by the related alarm counts. | |
|
|
|
• |
Virtual Machines. The number of virtual machines that are associated with the selected datacenter, followed by the related alarm counts. | |
|
|
Drill down on: |
|
|
|
• |
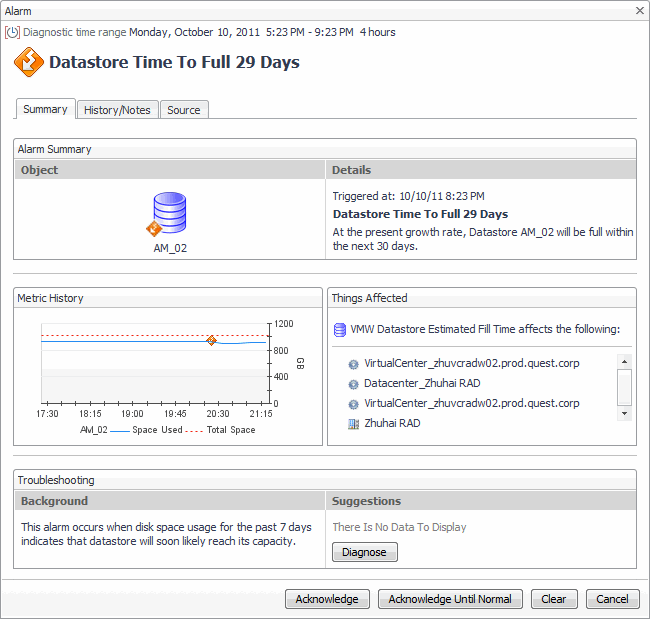
Alarm count. Displays the Alarms dialog box that shows a list of all related alarms. For each alarm entry, it shows its severity, the time at which it was triggered, the rule name that triggered the alarm, and the alarm message. |
|
|
|
|
• |
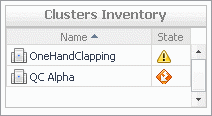
Clusters. Displays the Clusters Inventory dwell, showing the names and states of all clusters that are associated with the selected datacenter. |
|
|
|
|
• |
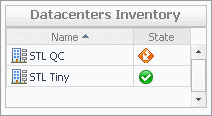
Datacenters. Displays the Datacenters Inventory dwell, showing the names and states of all datacenters that are associated with the selected datacenter. |
|
|
|
|
• |
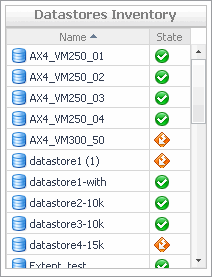
Datastores. Displays the Datastores Inventory dwell, showing the names and states of all datastores that are associated with the selected datacenter. |
|
|
|
|
• |
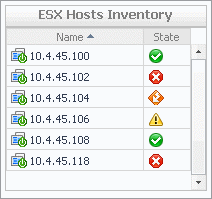
ESX Hosts. Displays the ESX Hosts Inventory dwell, showing the names and states of all ESX hosts that are associated with the selected datacenter. |
|
|
|
|
• |
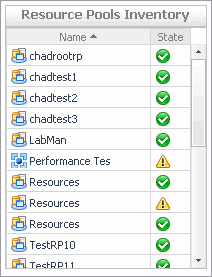
Resource Pools. Displays the Resource Pools Inventory dwell, showing the names and states of all resource pools that are associated with the selected datacenter. |
|
|
|
|
• |
Virtual Center. Displays the Virtual Centers Inventory dwell, showing the name and states of the selected datacenter. |
|
|
|
|
• |
Virtual Machines. Displays the Virtual Machines Inventory dwell, showing the names and states of all virtual machines that are associated with the selected datacenter. |
|
Summary - All Datacenters view
The Summary - All Datacenters view displays overall resource utilization information for a group of datacenters and shows the elements that consume the highest amount of system resources.
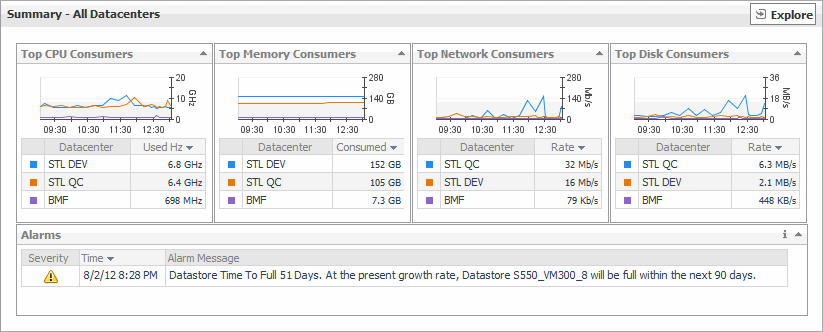
The Summary - All Datacenters view appears on the right.
This view is made up of the following embedded views:
Datacenters view
This tree view lists the datacenters that exist in your environment and shows their state.
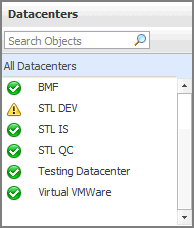
Selecting All Datacenters displays overall resource utilization for all datacenters in your integrated system, and the elements that consume the highest amount of system resources in the Summary - All Datacenters view on the right. Similarly, selecting a datacenter node shows datacenter-specific metrics in the Datacenter Summary view on the right.
Summary - Datastore view
The Summary - Datastore view shows the overall resource utilization and the amounts of system resource consumption for a physical datastore.
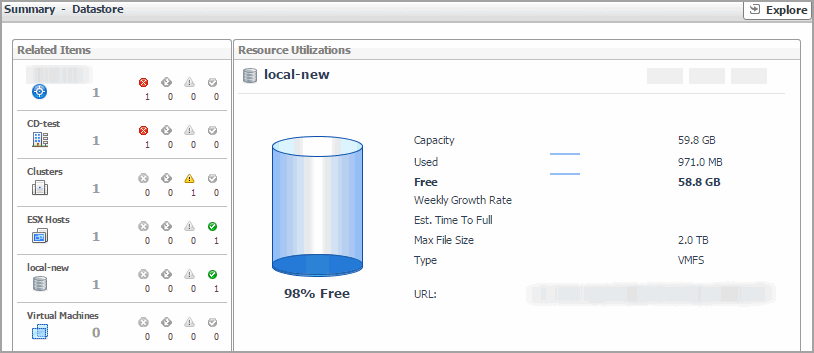
The Summary - Datastore view appears on the right.
This view is made up of the following embedded views:
|
|
Shows the numbers and states of the selected datastore and other components associated with this datastore. |
|
|
|
• |
Clusters. The number of clusters associated with the selected datastore, followed by the related alarm counts. | |
|
|
|
• |
Datacenter. The name of the datacenter associated with the selected datastore, followed by the related alarm counts. | |
|
|
|
• |
Datastore. The name of the selected datastore, followed by the related alarm counts. | |
|
|
|
• |
ESX Hosts. The number of hosts associated with the selected datastore, followed by the related alarm counts. | |
|
|
|
• |
Virtual Center. The name of the virtual center associated with the selected datastore, followed by the related alarm counts. | |
|
|
|
• |
Virtual Machines. The number of virtual machines that are associated with the selected datastore, followed by the related alarm counts. | |
|
|
Drill down on: |
|
|
|
• |
Alarm count. Displays the Alarms dialog box that shows a list of all related alarms. For each alarm entry, it shows its severity, the time at which it was triggered, the rule name that triggered the alarm, and the alarm message. |
|
|
|
|
• |
Clusters. Displays the Clusters Inventory dwell, showing the names and states of the clusters associated with the selected datastore. |
|
|
|
|
• |
Datacenter. Displays the Datacenters Inventory dwell, showing the name and state of the datacenter associated with the selected datastore. |
|
|
|
|
• |
Datastore. Displays the Datastores Inventory dwell, showing the name and state of the selected datastore. |
|
|
|
|
• |
Virtual Center. Displays the Virtual Centers Inventory dwell, showing the name and state of the virtual center associated with the selected datastore. |
|
|
|
|
• |
Virtual Machines. Displays the Virtual Machines Inventory dwell, showing the names and states of all virtual machines that are associated with the selected datastore. |
|