|
• |
Please select agent: select the agent which need configure. |
|
• |
Collect Metrics For Dashboard Only: Configure the agent just collect the metrics used for dashboard only. |
|
• |
Restore The Default Setting: Configure the agent to collect all metrics of VMware by default. |
|
• |
Save Edited Configuration: After editing these settings, click the Save Edited Collection Information button to save your configuration. |
|
• |
Name: The metrics name. |
|
• |
Collecting: Agent collect this metric or not, agent collect it when it selected. |
|
• |
Description: The description of metric. |
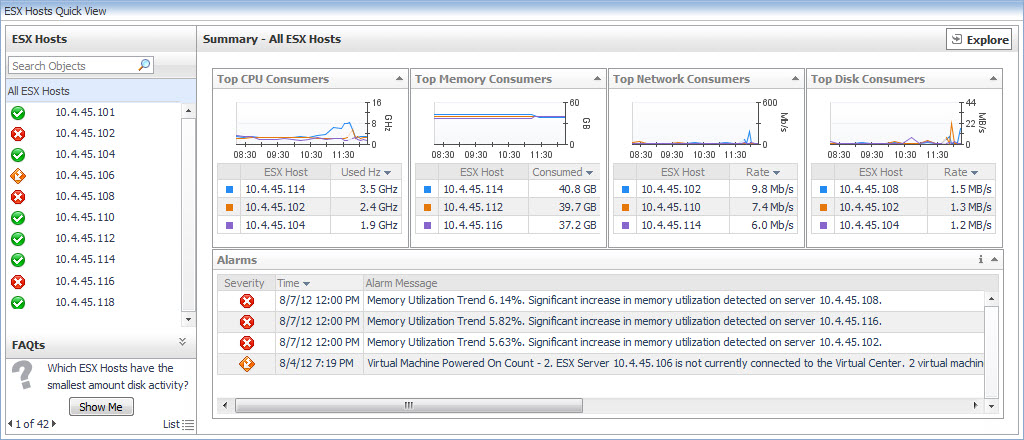
The Quick-View displays summary information about the objects you select from the Virtual Environment Overview, which is also available on the Virtual Environment Summary dashboard.
|
• |
On the VMware Environment dashboard, open the Monitoring tab. |
The Resource Pool Summary view shows the overall resource utilization and the amounts of system resource consumption for a physical resource pool.
|
1 |
On the VMware Environment dashboard, on the Monitoring tab, in the Virtual Environment Overview, select the Resource Pools tile. |
|
2 |
This view is made up of the following embedded views:
|
• |
|
Lists the alarms generated against the selected resource pool. | |||
| |||
| |||
| |||
 |
| |||
| |||
| |||
| |||
| |||
 | |||
| |||
| |||
| |||
| |||
 |
|
Shows the resource consumption for the selected resource pool broken down into four simple views. | |||
| |||
| |||
| |||
| |||
| |||
| |||
| |||
| |||
| |||
| |||
| |||
| |||
| |||
| |||
 | |||
 | |||
 | |||
 | |||
 | |||
 | |||
 |
The Summary - All Resource Pools view displays overall resource utilization information for a group of physical resource pools and shows the elements that consume the highest amount of system resources.
|
1 |
On the VMware Environment dashboard, on the Monitoring tab, in the Virtual Environment Overview, select the Resource Pools tile. |
|
2 |
This view is made up of the following embedded views:
|
• |
| |||
| |||
| |||
| |||
 | |||
|
|
Shows the top three resource pools with the highest average CPU utilization. | |||
| |||
| |||
 |
|
Shows the top three resource pools with the lowest available disk space. | |||
| |||
| |||
| |||
|
Shows the top three resource pools with the highest average memory utilization. | |||
| |||
| |||
| |||
|
Shows the top three resource pools that are consuming most network bandwidth. | |||
| |||
| |||
 | |||
|