|
1 |
If the dashboard is not already opened, select the dashboard from the My Dashboards node. |
|
2 |
|
• |
Change the text Style (for example, Small) |
|
• |
Type the Text to appear in the dashboard. |
|
• |
Add a Background Image. For more information, see Adding a Background Image to a portal or its text component . |
|
4 |
Click OK. |
|
1 |
If the dashboard is not already opened, select the dashboard from the My Dashboards node. |
|
2 |
|
3 |
By dragging a text component you can upload a background image, such as a map.
|
1 |
|
• |
For a portal, the choice is available on the General tab by choosing Properties > Edit basic properties. The Edit View Properties dialog box appears. |
|
• |
For the text component, the choice is available on the General tab by choosing Drag into portal to add text. The Entering User Text dialog box appears. |
|
• |
In the tree under Dashboard Development > Support > Maps, choose one of the mapped, themed images that are included with Foglight. |
|
• |
Upload your own image by clicking Upload Image. |
|
2 |
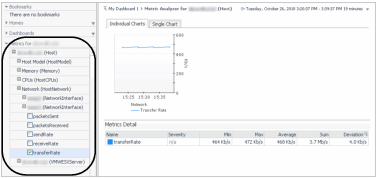
Select other metrics so you can view them in that same parent. For example, if you select receiveRate, the corresponding chart also appears in the Metric Analyzer view. |
|
3 |
Select the Individual Charts tab to display each metric individually or click the Single Chart tab to view all selected metrics in a single chart. |
|
NOTE: From any view you have created on your dashboard, you can click the Options icon ( |
|
NOTE: You can also customize your view to add a configurable drill-down so you can go to another existing view or a drill-down you have created. For example to configure a user action so that a popup appears when a metric is selected, select Edit Properties. In the Config Portlet dialog box, click the Actions tab and choose the Popup option. For more information on configuring actions, see Actions tab . |
