|
Note: Available for Oracle 10g and later.
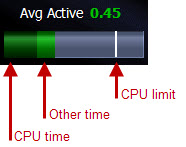
Average Active Sessions shows the sum of DB time over all sessions, divided by elapsed time. The Average Active Sessions gauge breaks this down further by showing CPU time (dark colored bar) and other time (light colored bar) in relation to the CPU limit (vertical white line).

Average Active Sessions can help you determine if a database is experiencing performance issues. A value greater than the CPU limit, indicates potential performance issues. This is shown on the Average Active Sessions gauge as either of the colored bars passing the vertical white line. How far the colored bar has passed the vertical white line indicates the severity of the performance issue. A value far greater than the CPU limit indicates that the database is experiencing bottlenecks.
From here, you can drill down to see detailed information on the wait events that may be contributing to the database performance issues. |