Dashboard location and UI elements
After installing Foglight Capacity Director, the Capacity Director dashboard appears in the Foglight Management Server.
|
3 |
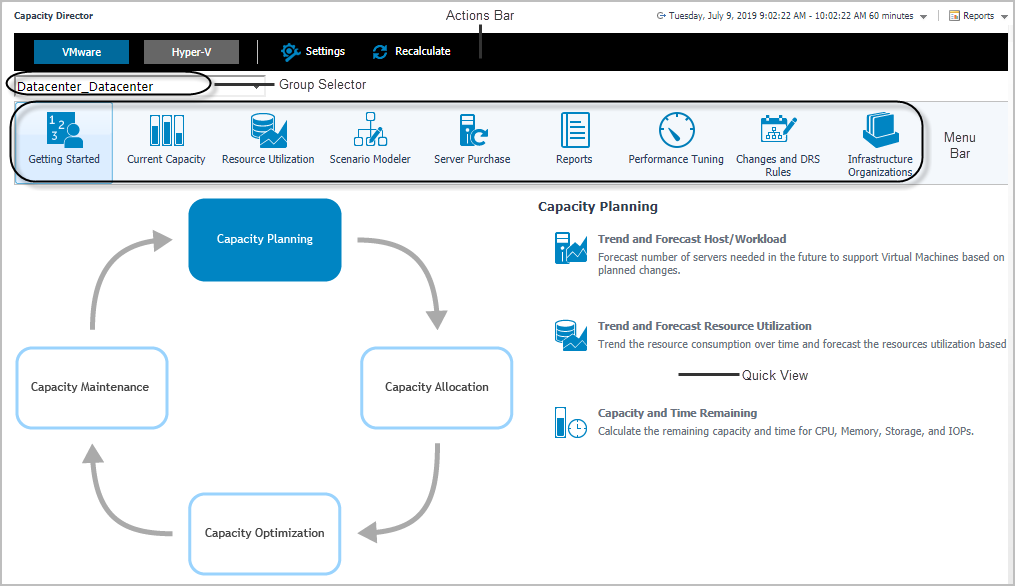
The Capacity Director dashboard consists of the following UI elements:
|
• |
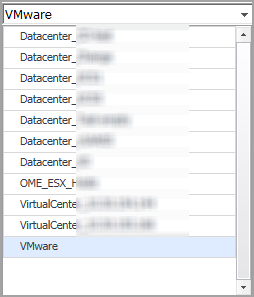
Group selector
Actions bar
The actions bar at the top of the screens contains the following options, Settings Menu and Recalculating Results.
Settings Menu
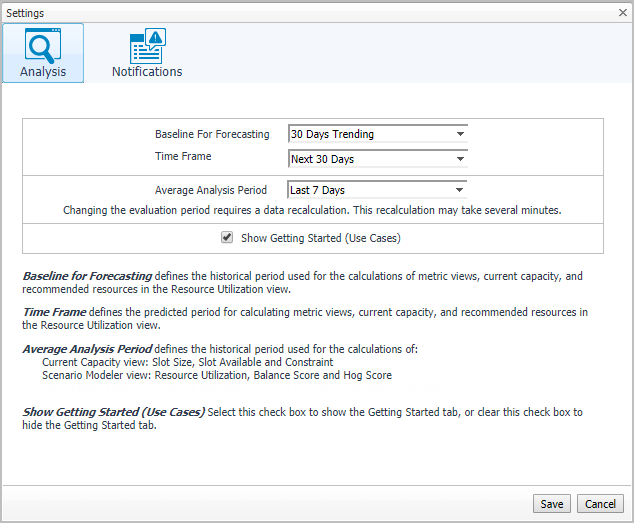
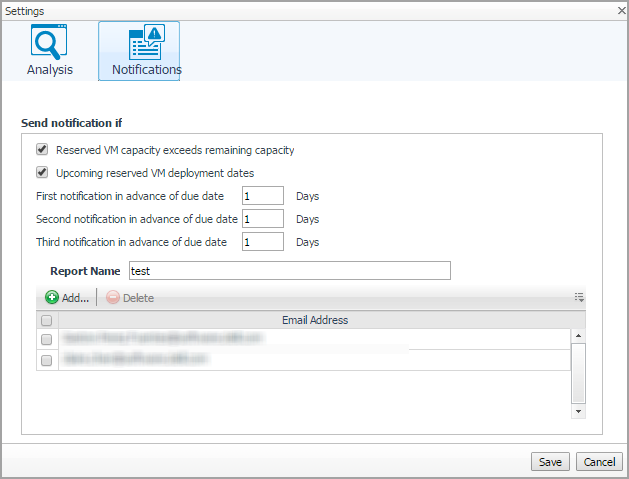
Click the Settings icon on the actions bar to open the Settings dialog box. For details about the settings that you can configure in this dialog, see the “Configuring Analysis” and “Configuring Notifications” sections.
|
• |
Baseline For Forecasting: Defines the historical period used for the calculations of metric views, current capacity, and recommended resources in the Resource Utilization view. The following options are available: 30 Days Trending (default option), 180 Days Trending, and 365 Days Trending. |
|
• |
Time Frame: Defines the predicted period for calculating metric views, current capacity, and recommended resources in the Resource Utilization view. The following options are available: Next 30 Days (default option), Next 60 Days, Next 90 Days, and Next 180 Days. |
|
• |
Average Analysis Period: Defines the historical period used for the calculations of: |
|
• |
Show Getting Started (Use Cases): Select this check box to show the Getting Started tab, or clear this check box to hide the Getting Started tab. |
|
3 |
Click Save. |
|
6 |
|
7 |
|
8 |
Click Save. |


