Toad provides an intuitive and efficient way to write, run, and test your SQL and PL/SQL code. Toad supports efficient code management for a single developer or a whole team of developers.
Analyze Code in the Editor
The Code Analysis Statistics window displays, and CRUD (create, read, update and delete) information and rule violations display in the tabs below the Editor.
Note: You can also click 
To describe rule violations
-
To view a brief description of the violation, hover over the blue line.
-
To view a detailed description of the violation, right-click the blue line and select Code Analysis Violations | Explain Rule.
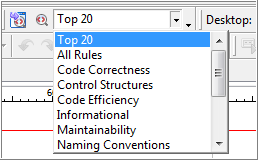
To change the rule set
Select a different rule set in the Code Analysis toolbar.

Optimize SQL
Work with Code
Optimize
Toad offers several features to help you optimize queries or view the performance statistics for the server. Although Toad provides access to these statistics and/or Oracle utilities, this section describes only how to use the features within Toad, not how to interpret the results.
For an excellent guide on SQL tuning, we suggest Oracle SQL - High Performance Tuning by Guy Harrison available from Prentice Hall Press.
See the online help for more information about these features.
Feature Description Optimize Current SQL Use Auto Optimize SQL to quickly optimize a single SQL statement. Toad searches for faster alternatives and allows you to compare them to the original statement and each other.
SQL Optimizer If you have a Toad Edition that includes the SQL Optimizer package, you can use it to help you optimize your code.
Explain Plan Explain Plan shows the path and order in which Oracle will process your statement. By processing Explain Plan on variations of a statement, you can see how the adjustments will affect the execution.
SQL Trace SQL Trace is a server-side trace utility that displays CPU, IO requirements, and resource usage for a statement. SQL Trace is a much more complete utility than Auto Trace; however, viewing the results can be difficult because the output file is created on the server.
Auto Trace Auto Trace is a mini version of SQL Trace that displays quick results directly on the client. In Toad, the results are displayed beneath the Editor window.
Profile PL/SQL
Work with CodeToad provides an intuitive and efficient way to write, run, and test your SQL and PL/SQL code. Toad supports efficient code management for a single developer or a whole team of developers.
