|
|
|
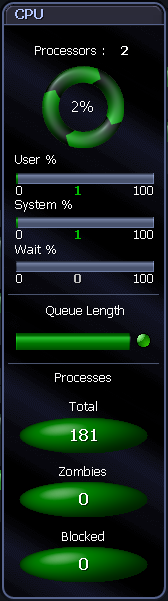
The CPU panel shows processor and load information for the Windows system: CPUs — The number of processors installed on the target system. Speed — The speed of the processor(s) installed on the target system. Type — The type of processor(s) installed on the target system (Intel Pentium III, for example). Up Time — Shows how long it has been since Windows was started on the machine being diagnosed. Total CPU Usage — This spinner represents the total amount of CPU being used on the machine being diagnosed. It includes CPU consumed by all windows processes. This component spins faster as CPU demands increase. Processor Queue Length — Shows the average number of threads (program execution units) that are waiting to run on each processor. A sustained average greater than three can indicate processor congestion. Processes — Shows the number of applications and services that are currently active on the system. Threads — Shows the number of threads currently active in all processes. A thread is a running portion of the owning process. Every process has at least one thread.
Page Outs per second — Shows the number of memory pages per second that are being written to disk from physical memory, in order to free up physical memory. The memory pages are checked first to see if they have been modified - if no modification has taken place, they are discarded. Page Faults per second — This is a measure of the number of page faults per second on the system. This value includes soft faults and hard faults. A page fault occurs when a process requires code or data that is not in its space in physical memory. A soft fault is when a memory page is not in the physical memory of the process, but resides in another segment of physical memory. A hard fault occurs when a memory page is not in the physical memory of the process, and has to be brought from disk.
Cache Writes — This flow shows the rate at which cache pages are written to disk from memory, in order to satisfy a write through request (an application request to not write information to cache, but directly to disk) or a cache flush (a regular writing of data from the write-cache to disk). Cache Reads — Shows the rate at which cache pages are read by applications from memory.
|
|
|
|
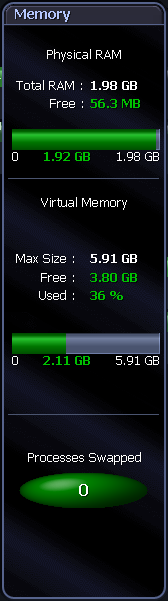
The Memory panel shows detailed information on the Windows system.: Total RAM — Shows the amount of actual RAM (Random Access Memory) in the machine. Free (Physical Memory) — Displays the amount of physical memory available to applications. Free Pct (Physical Memory) — Shows the percentage of physical memory that is currently available to applications. Physical Memory Gauge —
Max Size — Shows the maximum amount of virtual memory available without expanding the paging file. Free (Virtual Memory) — Shows the current amount of virtual memory available. Free Pct (Virtual Memory) — Shows the percentage of virtual memory that is currently available to applications. Virtual Memory gauge — Shows the total amount of Virtual Memory available without expanding the paging file, and the current amount of Virtual Memory that is in use.
Pages found in RAM —
Read Hit Ratio —
Pages Written/s —
Pages Read/s —
Disk Writes/s — Represents the rate of data being written to disk from memory. There is one Disk Writes dataflow for every disk in the Disks panel. Disk Reads/s — Represents the rate of data being read from disk to memory. There is one Disk Reads dataflow for every disk in the Disks panel. |
 |
|
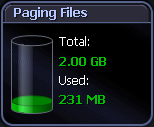
The Paging Files panel shows information on paging space for all paging files active on the system. The disk icon "fills up" as the total percentage of all paging files used increases. This is the total amount of space used by paging files as a percentage of the maximum size of all paging files. The disk icon also shows:
Note: This does not include any potential growth of the paging files. |
 |
|
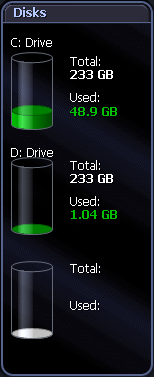
The Disks panel shows information for each logical disk on the system.:
The containers in the Disks panel represent the logical disks in the monitored system. The disk container fills up as the total percentage of used space increases. Note: You can control the contents and appearance of the Disk panel. Windows Disks Metrics |