Configuring the chart type is a key step in building a report widget. The KACE System Management Appliance offers a variety of chart types such as Bar, Line, Pie, Gauge and so on, each suited to different visualization needs. The application supports multiple chart types, and based on the selected chart type, the relevant fields in the Label and Axis Settings and Visualization Settings sections are dynamically populated. This topic helps you to understand how to configure chart types and customize their settings for optimal dashboard presentation.
The different chart types are as follows:
|
| |||
|
| |||
|
• |
Sample dashboard reports are available for your reference to help you understand how data is visualized and structured within the system. To view these samples, go to the Reports list and set the View By filter to Samples - Dashboard Reports. This will display a collection of example dashboards you can explore. |
The section below lists each supported chart type, the relevant fields and their description.
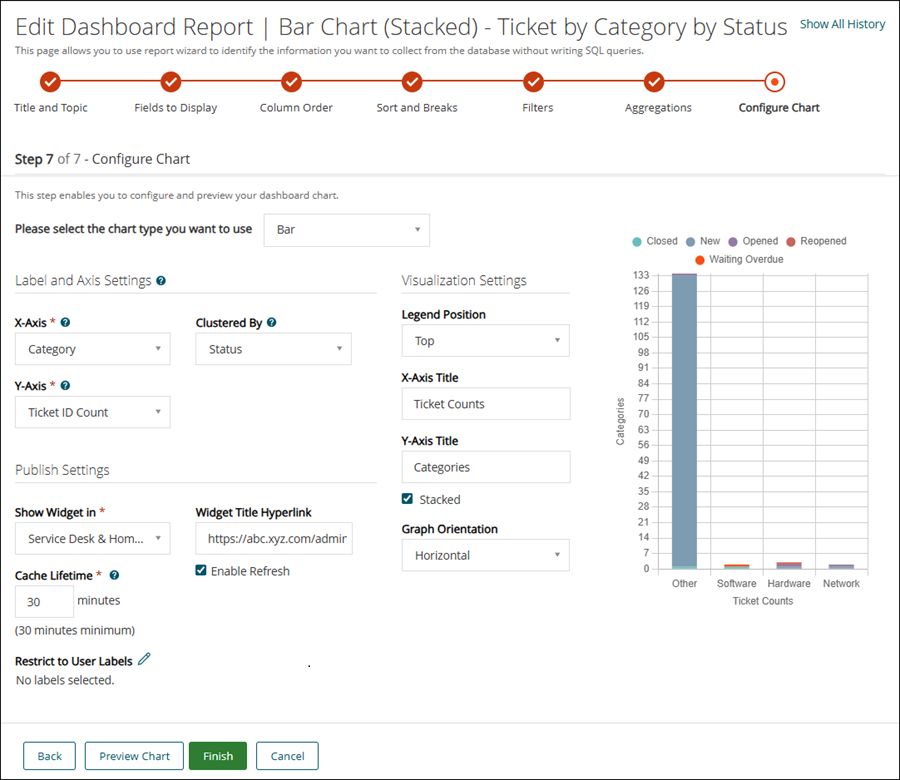
This chart displays data as rectangular bars on an X and Y axis. It is useful for comparing counts or values across categories such as Tickets by Category. You should select Bar from the Please select the chart type you want to use drop-down.
Configure the fields for the Bar chart in the following sections:
|
1. |
Label and Axis Settings Section |
|
This field specifies the categories or groups that represents the labels for the chart's X-Axis. | ||
|
For Example: Refer the image for Bar chart. X-Axis: Ticket Category(Other, Hardware, Network, Software), Y-Axis: Ticket Count, Cluster By: Status | ||
|
This field populates when the Clustered By field is set to None. | ||
|
Click to add more data points to the chart. This field populates when the Cluster By field is set to None. |
|
2. |
Visualization Settings Section |
|
Select the position from the drop-down. It specifies where the chart legend is displayed, such as top, bottom, left, or right of the chart. Select None to hide the legend. | ||
|
3. |
Publish Settings Section |
|
Defines where and how the widget is displayed on dashboards. | ||||
|
Select the dashboard category where you wish to make the widget available. All the widgets are available on the Home dashboard | ||||
|
Set the duration the data will be cached for. The minimum duration is 30 minutes | ||||
|
Select the Labels to show the widget only to the users assigned to the selected label. | ||||
| ||||
|
Click it to view how the chart will appear using the selected configuration. | ||||
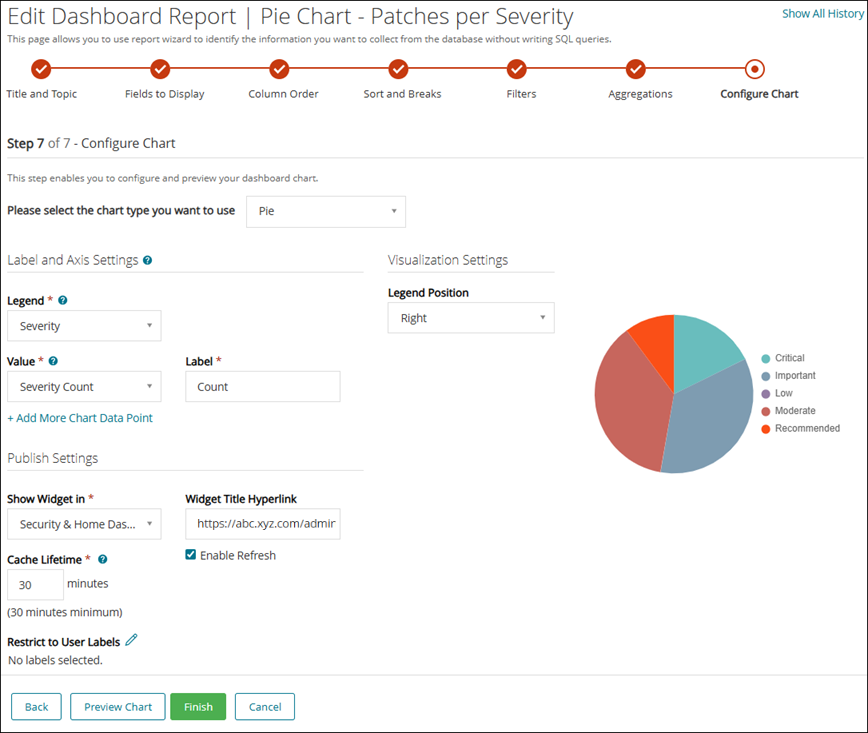
You should select Pie from the Please select the chart type you want to use drop-down. Configure the fields for the Pie chart in the following sections:
|
1. |
Label and Axis Settings Section |
|
Select a category or group from the drop-down list to represent each slice of the pie chart. | ||
|
For example, refer the image for Pie Chart - it is a Pie chart for Patches per Severity. Legend: Severity (Critcal, Important, Low, Moderate, Recommended) | ||
|
Click to add more data points on X-Axis. This field populates when the Cluster By field is set to None. |
|
2. |
Visualization Settings Section |
|
3. |
Publish Settings Section |
|
Defines where and how the widget is displayed on dashboards. | ||||
|
Select the dashboard category where you wish to make the widget available. All the widgets are available on the Home dashboard | ||||
|
Set the duration the data will be cached for. The minimum duration is 30 minutes | ||||
|
Select the Labels to show the widget only to the users assigned to the selected label. | ||||
| ||||
|
Click it to view how the chart will appear using the selected configuration. | ||||
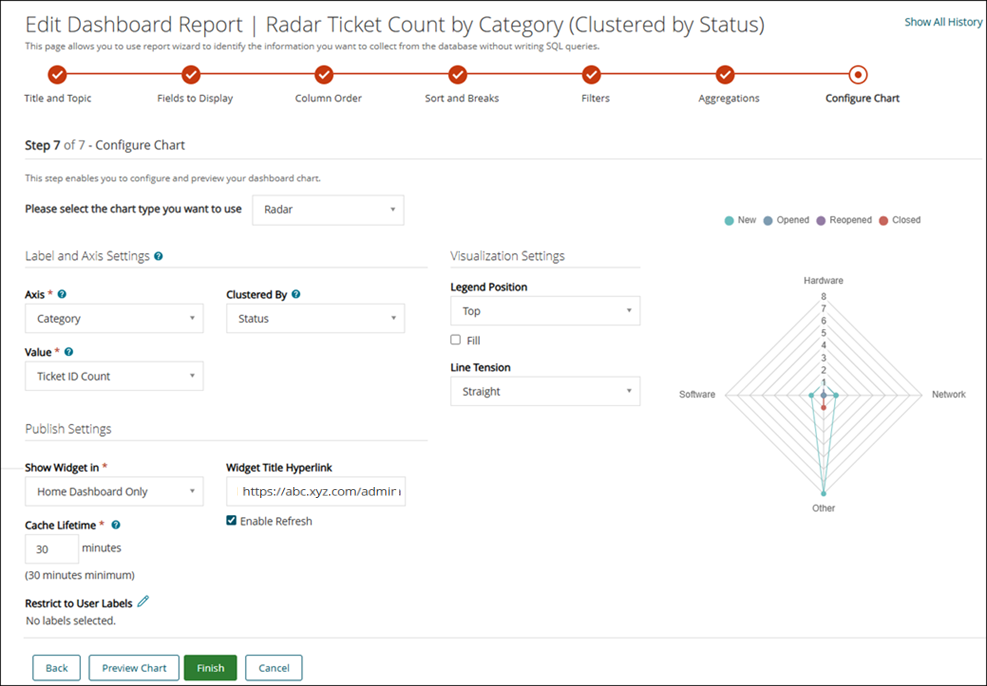
You should select Radar from the Please select the chart type you want to use drop-down. Configure the fields for the Radar chart in the following sections:
|
1. |
Label and Axis Settings Section |
|
Select a category or group from the drop-down list to represent segment of the chart. This field specifies the categories that will be displayed along the radial axes of the chart. | ||
|
For Example: Refer the image for Radar chart. Axis: Category, Value: Ticket ID Count, Cluster By: Status If you select None from the drop-down list the Label field populates. | ||
|
Click to add more data points. This field populates when the Cluster By field is set to None. |
|
Select an option to specify where the chart legend should displayed, such as top, bottom, left, or right of the chart. Select None to hide the legend. | ||
|
Select the field to fill the area under the line or within the radar shape with color. | ||
|
3. |
Publish Settings Section |
|
Defines where and how the widget is displayed on dashboards. | ||||
|
Select the dashboard category where you wish to make the widget available. All the widgets are available on the Home dashboard | ||||
|
Set the duration the data will be cached for. The minimum duration is 30 minutes | ||||
|
Select the Labels to show the widget only to the users assigned to the selected label. | ||||
| ||||
|
Click it to view how the chart will appear using the selected configuration. | ||||
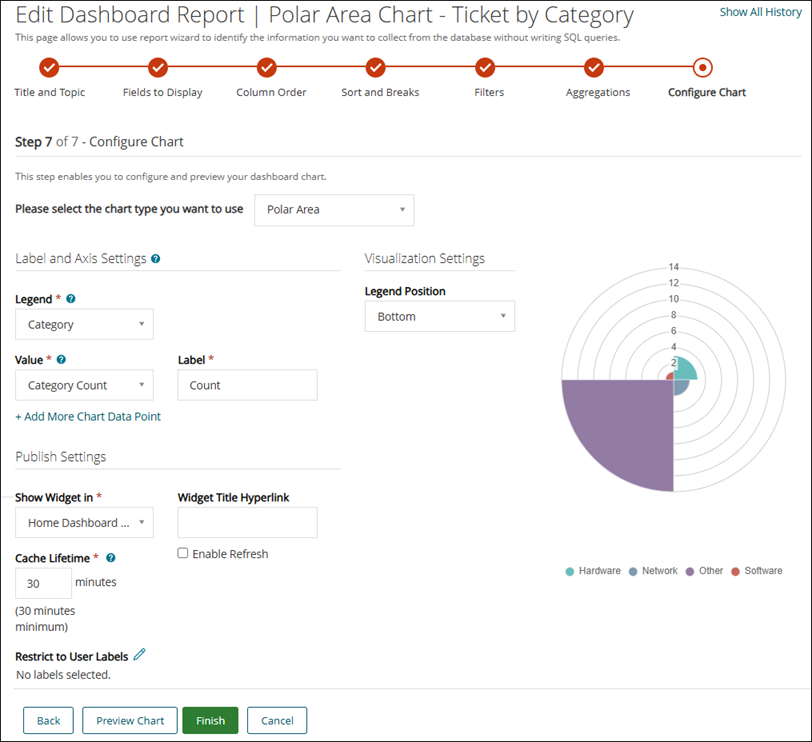
You should select Polar Area from the Please select the chart type you want to use drop-down. Configure the fields for the Polar Area chart in the following sections:
|
1. |
Label and Axis Settings Section |
|
Select a category or group from the drop-down list to represent segment of the chart. | ||
|
If you select None from the drop-down list the Label field populates. | ||
|
Click to add more data points. This field populates when the Cluster By field is set to None. |
|
2. |
Visualization Settings Section |
|
Select an option to specify where the chart legend should displayed, such as top, bottom, left, or right of the chart. Select None to hide the legend. |
|
3. |
Publish Settings Section |
|
Defines where and how the widget is displayed on dashboards. | ||||
|
Select the dashboard category where you wish to make the widget available. All the widgets are available on the Home dashboard | ||||
|
Set the duration the data will be cached for. The minimum duration is 30 minutes | ||||
|
Select the Labels to show the widget only to the users assigned to the selected label. | ||||
| ||||
|
Click it to view how the chart will appear using the selected configuration. | ||||
You should select World Geography from the Please select the chart type you want to use drop-down. Configure the fields for the World Geography chart in the following sections:
|
1. |
Label and Axis Settings Section |
|
2. |
Visualization Settings Section |
|
3. |
Publish Settings Section |
|
Defines where and how the widget is displayed on dashboards. | ||||
|
Select the dashboard category where you wish to make the widget available. All the widgets are available on the Home dashboard | ||||
|
Set the duration the data will be cached for. The minimum duration is 30 minutes | ||||
|
Select the Labels to show the widget only to the users assigned to the selected label. | ||||
| ||||
|
Click it to view how the chart will appear using the selected configuration. | ||||
The following is an image for World Geography chart for Users by Country.
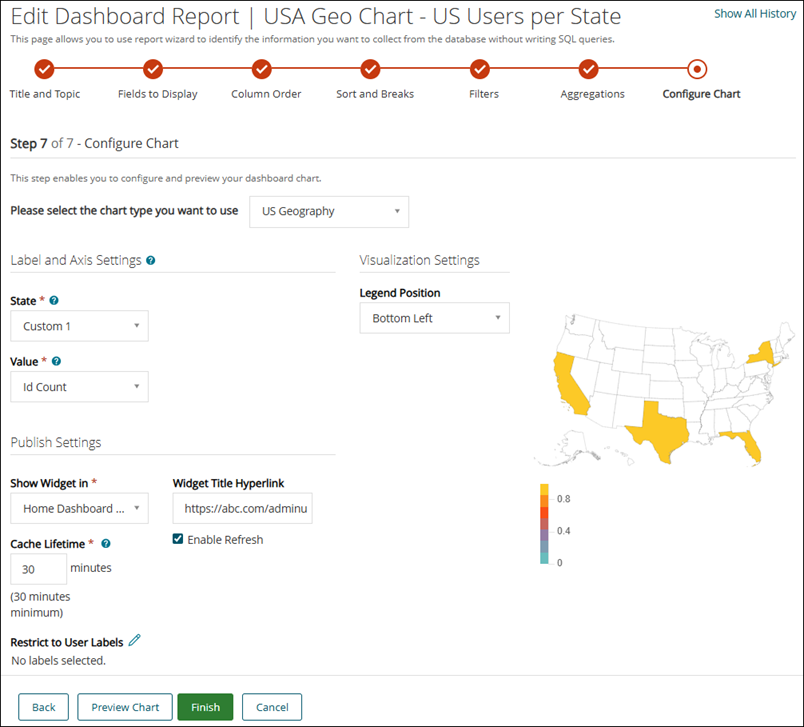
You should select US Geography from the Please select the chart type you want to use drop-down. Configure the fields for the US Geography chart in the following sections:
|
1. |
Label and Axis Settings Section |
|
2. |
Visualization Settings Section |
|
3. |
Publish Settings Section |
|
Defines where and how the widget is displayed on dashboards. | ||||
|
Select the dashboard category where you wish to make the widget available. All the widgets are available on the Home dashboard | ||||
|
Set the duration the data will be cached for. The minimum duration is 30 minutes | ||||
|
Select the Labels to show the widget only to the users assigned to the selected label. | ||||
| ||||
|
Click it to view how the chart will appear using the selected configuration. | ||||
The following is an image for US Geography chart for US users per State.
You should select Table from the Please select the chart type you want to use drop-down. Configure the fields for the Table chart in the following sections:
|
1. |
Label and Axis Settings Section |
|
If you select None from the drop-down list the Label field populates. | ||
|
Click to add more data points. This field populates when the Cluster By field is set to None. |
|
2. |
Publish Settings Section |
|
Defines where and how the widget is displayed on dashboards. | ||||
|
Select the dashboard category where you wish to make the widget available. All the widgets are available on the Home dashboard | ||||
|
Set the duration the data will be cached for. The minimum duration is 30 minutes | ||||
|
Select the Labels to show the widget only to the users assigned to the selected label. | ||||
| ||||
|
Click it to view how the chart will appear using the selected configuration. | ||||
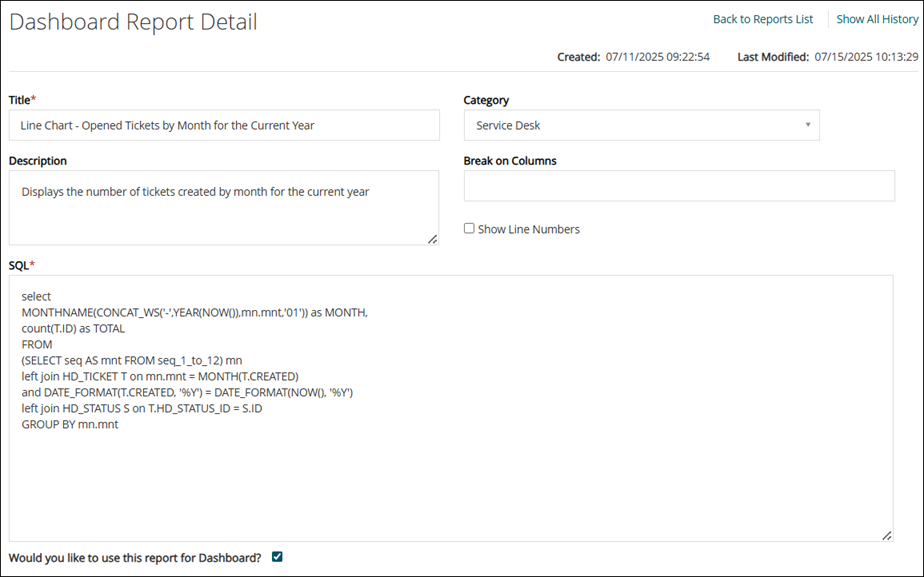
Below is a sample for creating a dashboard report using SQL queries.
Once you add the details for creating report with SQL (for more information, refer Create dashboard report using SQL queries), you should select Would you like to use this report for Dashboard. Configure the fields for the Progress chart in the following sections:
|
Select the option if you want to display the report on the dashboard. Once you select this option, the following fields are displayed. | |
|
You should select Progress from the drop-down. |
|
2. |
Label and Axis Settings Section |
|
It defines the current progress or achieved amount to be visualized on the chart. | ||
|
3. |
Visualization Settings Section |
|
4. |
Publish Settings Section |
|
Defines where and how the widget is displayed on dashboards. | ||||
|
Select the dashboard category where you wish to make the widget available. All the widgets are available on the Home dashboard | ||||
|
Set the duration the data will be cached for. The minimum duration is 30 minutes | ||||
|
Select the Labels to show the widget only to the users assigned to the selected label. | ||||
| ||||
|
Click it to view how the chart will appear using the selected configuration. | ||||
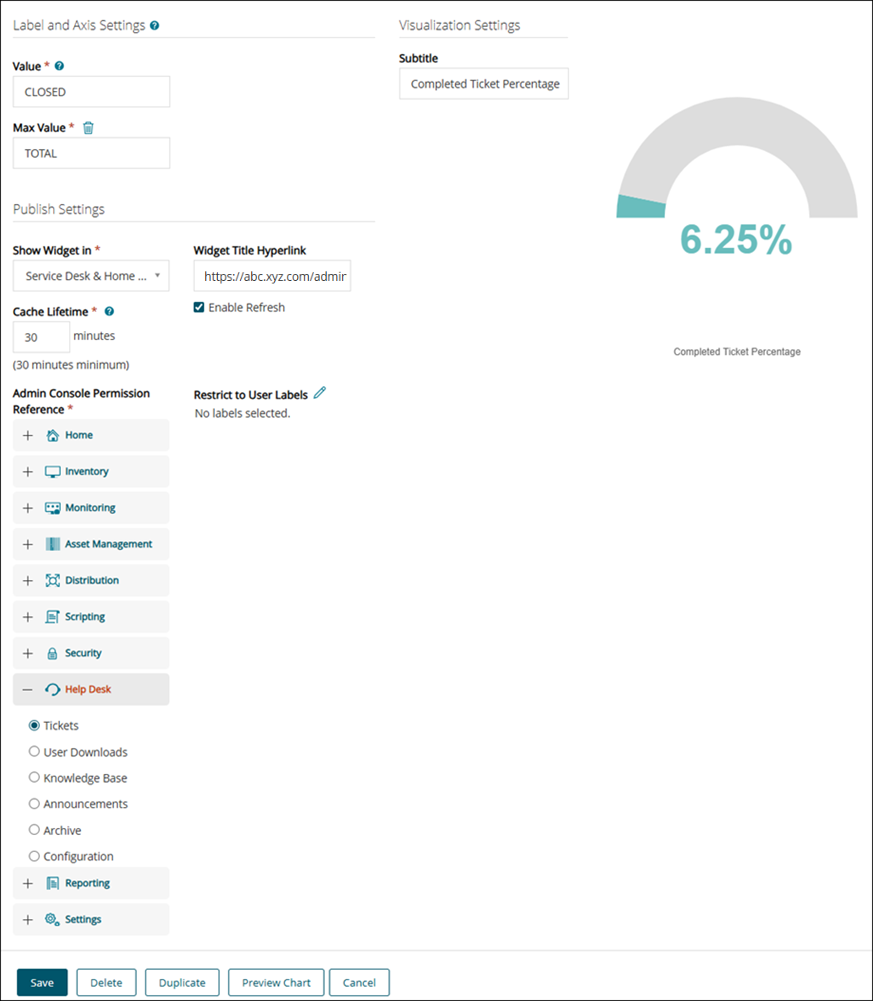
Once you add the details for creating report with SQL (for more information, refer Create dashboard report using SQL queries), you should select Would you like to use this report for Dashboard. Configure the fields for the Gauge chart for the following sections:
|
Select the option if you want to display the report on the dashboard. Once you select this option, the following fields are displayed. | |
|
You should select Gauge from the drop-down. |
|
2. |
Label and Axis Settings Section |
|
It defines the upper limit or full scale of the gauge. This sets the maximum range against which the current value is evaluated |
|
3. |
Visualization Settings Section |
|
Select this to display the numerical value and range directly on the gauge for quick reference. |
|
4. |
Publish Settings Section |
|
Defines where and how the widget is displayed on dashboards. | ||||
|
Select the dashboard category where you wish to make the widget available. All the widgets are available on the Home dashboard | ||||
|
Set the duration the data will be cached for. The minimum duration is 30 minutes | ||||
|
Select the Labels to show the widget only to the users assigned to the selected label. | ||||
| ||||
|
Click it to view how the chart will appear using the selected configuration. | ||||
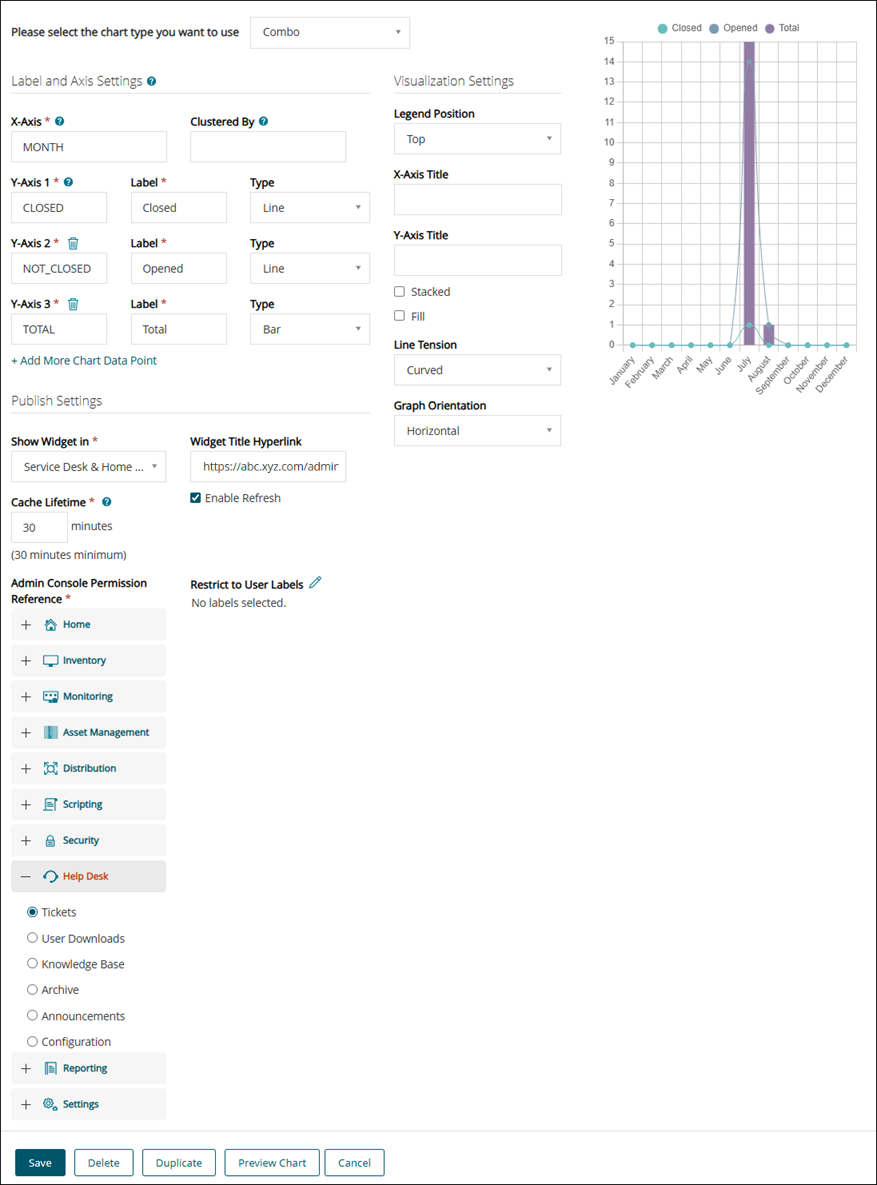
Once you add the details for creating report with SQL (for more information, refer Create dashboard report using SQL queries), you should select Would you like to use this report for Dashboard. Configure the following fields for the Combo chart:
|
Select the option if you want to display the report on the dashboard. Once you select this option, the following fields are displayed. | |
|
You should select Combo from the drop-down. |
|
2. |
Label and Axis Settings Section |
|
This field specifies the categories or groups that represents the labels for the chart's X-Axis. | ||
|
This field populates when the Cluster By field is set to None. | ||
|
Select the type of bar you want to display on the chart - Line or a Bar. | ||
|
This field populates when the Cluster By field is set to None. | ||
|
Select the type of bar you want to display on the chart - Line or a Bar. | ||
|
This field populates when the Cluster By field is set to None. | ||
|
Select the type of bar you want to display on the chart - Line or a Bar. | ||
|
Click to add more data points to the chart. This field populates when the Cluster By field is set to None. |
|
4. |
Publish Settings Section |
|
Defines where and how the widget is displayed on dashboards. | ||||
|
Select the dashboard category where you wish to make the widget available. All the widgets are available on the Home dashboard | ||||
|
Set the duration the data will be cached for. The minimum duration is 30 minutes | ||||
|
Select the Labels to show the widget only to the users assigned to the selected label. | ||||
| ||||
|
Click it to view how the chart will appear using the selected configuration. | ||||
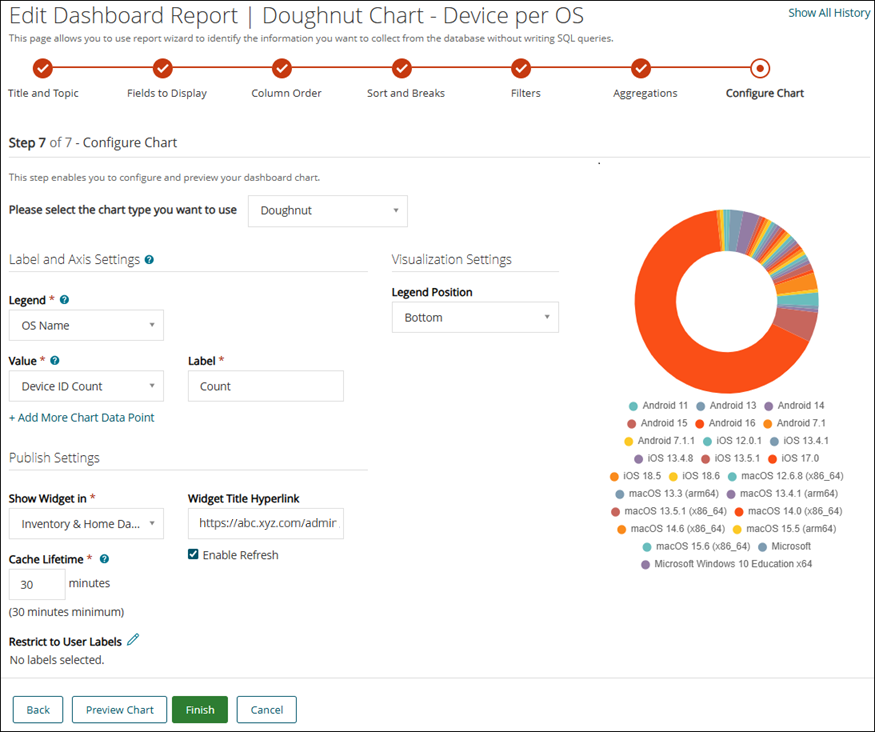
You should select Doughnut from the Please select the chart type you want to use drop-down. Configure the fields for the Doughnut chart in the following sections:
|
1. |
Label and Axis Settings Section |
|
3. |
Publish Settings Section |
|
Defines where and how the widget is displayed on dashboards. | ||||
|
Select the dashboard category where you wish to make the widget available. All the widgets are available on the Home dashboard | ||||
|
Set the duration the data will be cached for. The minimum duration is 30 minutes | ||||
|
Select the Labels to show the widget only to the users assigned to the selected label. | ||||
| ||||
|
Click it to view how the chart will appear using the selected configuration. | ||||
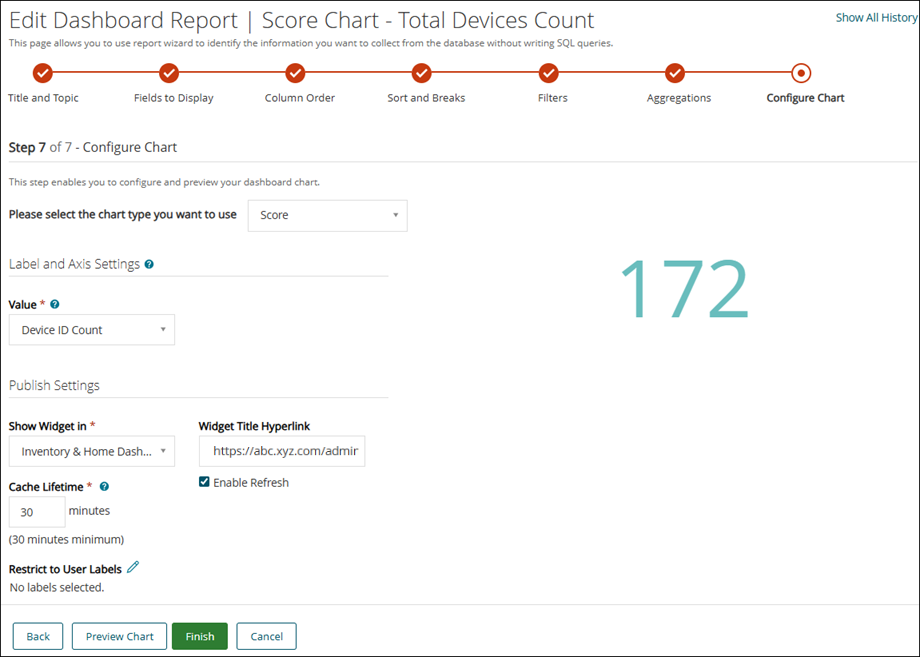
You should select Score from the Please select the chart type you want to use drop-down. Configure the fields for the Score chart in the following sections:
|
1. |
Label and Axis Settings Section |
|
For example, refer the image for Score Chart - it is a Score chart for Total Device Count. Value: Device ID Count |
|
2. |
Publish Settings Section |
|
Defines where and how the widget is displayed on dashboards. | ||||
|
Select the dashboard category where you wish to make the widget available. All the widgets are available on the Home dashboard | ||||
|
Set the duration the data will be cached for. The minimum duration is 30 minutes | ||||
|
Select the Labels to show the widget only to the users assigned to the selected label. | ||||
| ||||
|
Click it to view how the chart will appear using the selected configuration. | ||||
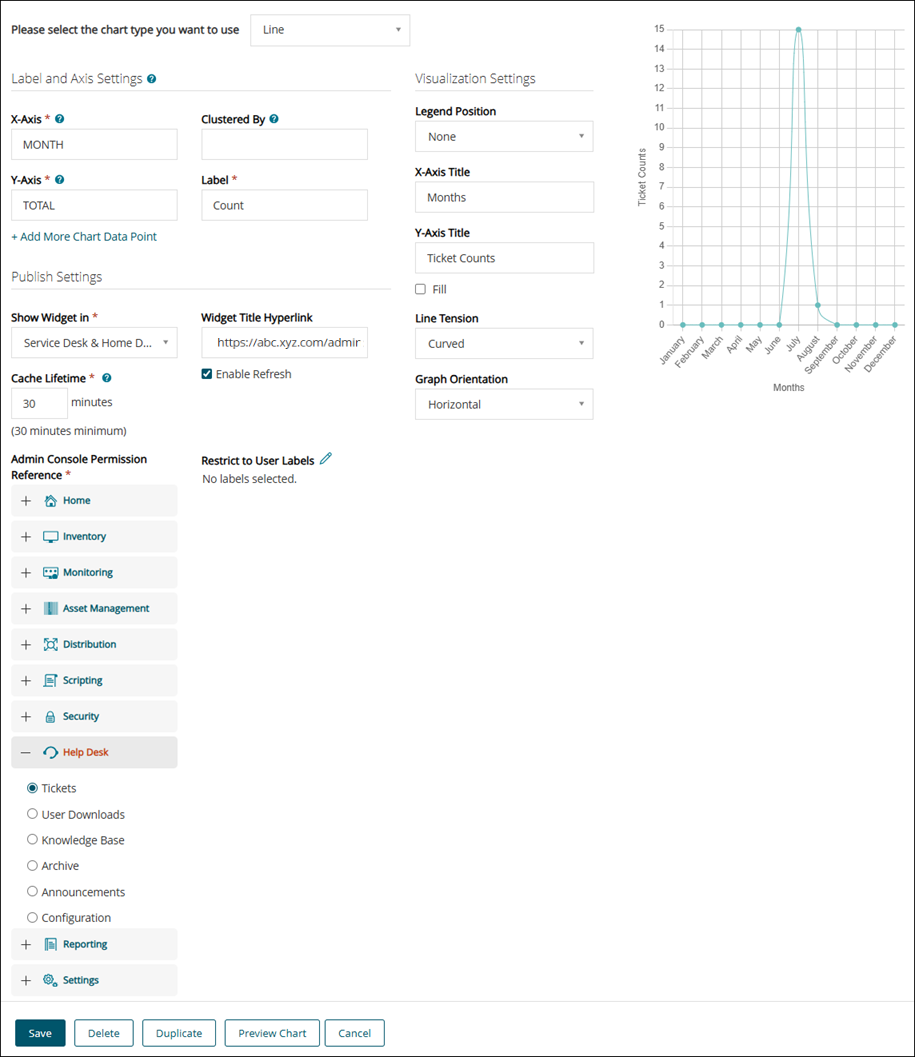
Once you add the details for creating report with SQL (for more information, refer Create dashboard report using SQL queries), you should select Would you like to use this report for Dashboard. Configure the fields for the Line chart in the following sections:
|
Select the option if you want to display the report on the dashboard. Once you select this option, the following fields are displayed. | |
|
You should select Line from the drop-down. |
|
2. |
Label and Axis Settings Section |
|
Click to add more data points on Y-Axis and add a Label to it. |
|
3. |
Visualization Settings Section |
|
4. |
Publish Settings Section |
|
Defines where and how the widget is displayed on dashboards. | ||||
|
Select the dashboard category where you wish to make the widget available. All the widgets are available on the Home dashboard | ||||
|
Set the duration the data will be cached for. The minimum duration is 30 minutes | ||||
|
Select the Labels to show the widget only to the users assigned to the selected label. | ||||
| ||||
|
Click it to view how the chart will appear using the selected configuration. | ||||
Here are some guidelines when using the following chart types:
|
• |
Use Line or Bar charts to analyze time-based trends such as patch deployments or script execution history. |
|
• |
Pie and Doughnut charts are ideal for showing categorical distribution, such as OS breakdown or ticket categories. |
|
• |
Table view is best when precise data and filtering are needed, such as listing vulnerable devices or script results. |
|
• |
Score, Gauge, and Progress charts are used to highlight a single metric or indicate how close the system is to a defined goal. |
|
• |
Radar and Polar Area charts can compare metrics like compliance ratings across multiple policies or departments. |
|
• |
World and US Geography charts help visualize endpoint distribution geographically for global and regional tracking. |
The widgets, once added to a dashboard, are removed from the Add Widget list to prevent duplication. However, some widgets can be added multiple times to a dashboard. If the widget is added to dashboard, you can still view it in the Add Widget list. You can add them again with different parameters (for example, grouping by different fields such as owner or priority).
The following is the list of widgets that can be added repeatedly:
Configuring the chart type is a key step in building a report widget. The KACE System Management Appliance offers a variety of chart types such as Bar, Line, Pie, Gauge and so on, each suited to different visualization needs. The application supports multiple chart types, and based on the selected chart type, the relevant fields in the Label and Axis Settings and Visualization Settings sections are dynamically populated. This topic helps you to understand how to configure chart types and customize their settings for optimal dashboard presentation.
The different chart types are as follows:
|
| |||
|
| |||
|
• |
Sample dashboard reports are available for your reference to help you understand how data is visualized and structured within the system. To view these samples, go to the Reports list and set the View By filter to Samples - Dashboard Reports. This will display a collection of example dashboards you can explore. |
The section below lists each supported chart type, the relevant fields and their description.
This chart displays data as rectangular bars on an X and Y axis. It is useful for comparing counts or values across categories such as Tickets by Category. You should select Bar from the Please select the chart type you want to use drop-down.
Configure the fields for the Bar chart in the following sections:
|
1. |
Label and Axis Settings Section |
|
This field specifies the categories or groups that represents the labels for the chart's X-Axis. | ||
|
For Example: Refer the image for Bar chart. X-Axis: Ticket Category(Other, Hardware, Network, Software), Y-Axis: Ticket Count, Cluster By: Status | ||
|
This field populates when the Clustered By field is set to None. | ||
|
Click to add more data points to the chart. This field populates when the Cluster By field is set to None. |
|
2. |
Visualization Settings Section |
|
Select the position from the drop-down. It specifies where the chart legend is displayed, such as top, bottom, left, or right of the chart. Select None to hide the legend. | ||
|
3. |
Publish Settings Section |
|
Defines where and how the widget is displayed on dashboards. | ||||
|
Select the dashboard category where you wish to make the widget available. All the widgets are available on the Home dashboard | ||||
|
Set the duration the data will be cached for. The minimum duration is 30 minutes | ||||
|
Select the Labels to show the widget only to the users assigned to the selected label. | ||||
| ||||
|
Click it to view how the chart will appear using the selected configuration. | ||||
You should select Pie from the Please select the chart type you want to use drop-down. Configure the fields for the Pie chart in the following sections:
|
1. |
Label and Axis Settings Section |
|
Select a category or group from the drop-down list to represent each slice of the pie chart. | ||
|
For example, refer the image for Pie Chart - it is a Pie chart for Patches per Severity. Legend: Severity (Critcal, Important, Low, Moderate, Recommended) | ||
|
Click to add more data points on X-Axis. This field populates when the Cluster By field is set to None. |
|
2. |
Visualization Settings Section |
|
3. |
Publish Settings Section |
|
Defines where and how the widget is displayed on dashboards. | ||||
|
Select the dashboard category where you wish to make the widget available. All the widgets are available on the Home dashboard | ||||
|
Set the duration the data will be cached for. The minimum duration is 30 minutes | ||||
|
Select the Labels to show the widget only to the users assigned to the selected label. | ||||
| ||||
|
Click it to view how the chart will appear using the selected configuration. | ||||
You should select Radar from the Please select the chart type you want to use drop-down. Configure the fields for the Radar chart in the following sections:
|
1. |
Label and Axis Settings Section |
|
Select a category or group from the drop-down list to represent segment of the chart. This field specifies the categories that will be displayed along the radial axes of the chart. | ||
|
For Example: Refer the image for Radar chart. Axis: Category, Value: Ticket ID Count, Cluster By: Status If you select None from the drop-down list the Label field populates. | ||
|
Click to add more data points. This field populates when the Cluster By field is set to None. |
|
Select an option to specify where the chart legend should displayed, such as top, bottom, left, or right of the chart. Select None to hide the legend. | ||
|
Select the field to fill the area under the line or within the radar shape with color. | ||
|
3. |
Publish Settings Section |
|
Defines where and how the widget is displayed on dashboards. | ||||
|
Select the dashboard category where you wish to make the widget available. All the widgets are available on the Home dashboard | ||||
|
Set the duration the data will be cached for. The minimum duration is 30 minutes | ||||
|
Select the Labels to show the widget only to the users assigned to the selected label. | ||||
| ||||
|
Click it to view how the chart will appear using the selected configuration. | ||||
You should select Polar Area from the Please select the chart type you want to use drop-down. Configure the fields for the Polar Area chart in the following sections:
|
1. |
Label and Axis Settings Section |
|
Select a category or group from the drop-down list to represent segment of the chart. | ||
|
If you select None from the drop-down list the Label field populates. | ||
|
Click to add more data points. This field populates when the Cluster By field is set to None. |
|
2. |
Visualization Settings Section |
|
Select an option to specify where the chart legend should displayed, such as top, bottom, left, or right of the chart. Select None to hide the legend. |
|
3. |
Publish Settings Section |
|
Defines where and how the widget is displayed on dashboards. | ||||
|
Select the dashboard category where you wish to make the widget available. All the widgets are available on the Home dashboard | ||||
|
Set the duration the data will be cached for. The minimum duration is 30 minutes | ||||
|
Select the Labels to show the widget only to the users assigned to the selected label. | ||||
| ||||
|
Click it to view how the chart will appear using the selected configuration. | ||||
You should select World Geography from the Please select the chart type you want to use drop-down. Configure the fields for the World Geography chart in the following sections:
|
1. |
Label and Axis Settings Section |
|
2. |
Visualization Settings Section |
|
3. |
Publish Settings Section |
|
Defines where and how the widget is displayed on dashboards. | ||||
|
Select the dashboard category where you wish to make the widget available. All the widgets are available on the Home dashboard | ||||
|
Set the duration the data will be cached for. The minimum duration is 30 minutes | ||||
|
Select the Labels to show the widget only to the users assigned to the selected label. | ||||
| ||||
|
Click it to view how the chart will appear using the selected configuration. | ||||
The following is an image for World Geography chart for Users by Country.
You should select US Geography from the Please select the chart type you want to use drop-down. Configure the fields for the US Geography chart in the following sections:
|
1. |
Label and Axis Settings Section |
|
2. |
Visualization Settings Section |
|
3. |
Publish Settings Section |
|
Defines where and how the widget is displayed on dashboards. | ||||
|
Select the dashboard category where you wish to make the widget available. All the widgets are available on the Home dashboard | ||||
|
Set the duration the data will be cached for. The minimum duration is 30 minutes | ||||
|
Select the Labels to show the widget only to the users assigned to the selected label. | ||||
| ||||
|
Click it to view how the chart will appear using the selected configuration. | ||||
The following is an image for US Geography chart for US users per State.
You should select Table from the Please select the chart type you want to use drop-down. Configure the fields for the Table chart in the following sections:
|
1. |
Label and Axis Settings Section |
|
If you select None from the drop-down list the Label field populates. | ||
|
Click to add more data points. This field populates when the Cluster By field is set to None. |
|
2. |
Publish Settings Section |
|
Defines where and how the widget is displayed on dashboards. | ||||
|
Select the dashboard category where you wish to make the widget available. All the widgets are available on the Home dashboard | ||||
|
Set the duration the data will be cached for. The minimum duration is 30 minutes | ||||
|
Select the Labels to show the widget only to the users assigned to the selected label. | ||||
| ||||
|
Click it to view how the chart will appear using the selected configuration. | ||||
Below is a sample for creating a dashboard report using SQL queries.
Once you add the details for creating report with SQL (for more information, refer Create dashboard report using SQL queries), you should select Would you like to use this report for Dashboard. Configure the fields for the Progress chart in the following sections:
|
Select the option if you want to display the report on the dashboard. Once you select this option, the following fields are displayed. | |
|
You should select Progress from the drop-down. |
|
2. |
Label and Axis Settings Section |
|
It defines the current progress or achieved amount to be visualized on the chart. | ||
|
3. |
Visualization Settings Section |
|
4. |
Publish Settings Section |
|
Defines where and how the widget is displayed on dashboards. | ||||
|
Select the dashboard category where you wish to make the widget available. All the widgets are available on the Home dashboard | ||||
|
Set the duration the data will be cached for. The minimum duration is 30 minutes | ||||
|
Select the Labels to show the widget only to the users assigned to the selected label. | ||||
| ||||
|
Click it to view how the chart will appear using the selected configuration. | ||||
Once you add the details for creating report with SQL (for more information, refer Create dashboard report using SQL queries), you should select Would you like to use this report for Dashboard. Configure the fields for the Gauge chart for the following sections:
|
Select the option if you want to display the report on the dashboard. Once you select this option, the following fields are displayed. | |
|
You should select Gauge from the drop-down. |
|
2. |
Label and Axis Settings Section |
|
It defines the upper limit or full scale of the gauge. This sets the maximum range against which the current value is evaluated |
|
3. |
Visualization Settings Section |
|
Select this to display the numerical value and range directly on the gauge for quick reference. |
|
4. |
Publish Settings Section |
|
Defines where and how the widget is displayed on dashboards. | ||||
|
Select the dashboard category where you wish to make the widget available. All the widgets are available on the Home dashboard | ||||
|
Set the duration the data will be cached for. The minimum duration is 30 minutes | ||||
|
Select the Labels to show the widget only to the users assigned to the selected label. | ||||
| ||||
|
Click it to view how the chart will appear using the selected configuration. | ||||
Once you add the details for creating report with SQL (for more information, refer Create dashboard report using SQL queries), you should select Would you like to use this report for Dashboard. Configure the following fields for the Combo chart:
|
Select the option if you want to display the report on the dashboard. Once you select this option, the following fields are displayed. | |
|
You should select Combo from the drop-down. |
|
2. |
Label and Axis Settings Section |
|
This field specifies the categories or groups that represents the labels for the chart's X-Axis. | ||
|
This field populates when the Cluster By field is set to None. | ||
|
Select the type of bar you want to display on the chart - Line or a Bar. | ||
|
This field populates when the Cluster By field is set to None. | ||
|
Select the type of bar you want to display on the chart - Line or a Bar. | ||
|
This field populates when the Cluster By field is set to None. | ||
|
Select the type of bar you want to display on the chart - Line or a Bar. | ||
|
Click to add more data points to the chart. This field populates when the Cluster By field is set to None. |
|
4. |
Publish Settings Section |
|
Defines where and how the widget is displayed on dashboards. | ||||
|
Select the dashboard category where you wish to make the widget available. All the widgets are available on the Home dashboard | ||||
|
Set the duration the data will be cached for. The minimum duration is 30 minutes | ||||
|
Select the Labels to show the widget only to the users assigned to the selected label. | ||||
| ||||
|
Click it to view how the chart will appear using the selected configuration. | ||||
You should select Doughnut from the Please select the chart type you want to use drop-down. Configure the fields for the Doughnut chart in the following sections:
|
1. |
Label and Axis Settings Section |
|
3. |
Publish Settings Section |
|
Defines where and how the widget is displayed on dashboards. | ||||
|
Select the dashboard category where you wish to make the widget available. All the widgets are available on the Home dashboard | ||||
|
Set the duration the data will be cached for. The minimum duration is 30 minutes | ||||
|
Select the Labels to show the widget only to the users assigned to the selected label. | ||||
| ||||
|
Click it to view how the chart will appear using the selected configuration. | ||||
You should select Score from the Please select the chart type you want to use drop-down. Configure the fields for the Score chart in the following sections:
|
1. |
Label and Axis Settings Section |
|
For example, refer the image for Score Chart - it is a Score chart for Total Device Count. Value: Device ID Count |
|
2. |
Publish Settings Section |
|
Defines where and how the widget is displayed on dashboards. | ||||
|
Select the dashboard category where you wish to make the widget available. All the widgets are available on the Home dashboard | ||||
|
Set the duration the data will be cached for. The minimum duration is 30 minutes | ||||
|
Select the Labels to show the widget only to the users assigned to the selected label. | ||||
| ||||
|
Click it to view how the chart will appear using the selected configuration. | ||||
Once you add the details for creating report with SQL (for more information, refer Create dashboard report using SQL queries), you should select Would you like to use this report for Dashboard. Configure the fields for the Line chart in the following sections:
|
Select the option if you want to display the report on the dashboard. Once you select this option, the following fields are displayed. | |
|
You should select Line from the drop-down. |
|
2. |
Label and Axis Settings Section |
|
Click to add more data points on Y-Axis and add a Label to it. |
|
3. |
Visualization Settings Section |
|
4. |
Publish Settings Section |
|
Defines where and how the widget is displayed on dashboards. | ||||
|
Select the dashboard category where you wish to make the widget available. All the widgets are available on the Home dashboard | ||||
|
Set the duration the data will be cached for. The minimum duration is 30 minutes | ||||
|
Select the Labels to show the widget only to the users assigned to the selected label. | ||||
| ||||
|
Click it to view how the chart will appear using the selected configuration. | ||||
Here are some guidelines when using the following chart types:
|
• |
Use Line or Bar charts to analyze time-based trends such as patch deployments or script execution history. |
|
• |
Pie and Doughnut charts are ideal for showing categorical distribution, such as OS breakdown or ticket categories. |
|
• |
Table view is best when precise data and filtering are needed, such as listing vulnerable devices or script results. |
|
• |
Score, Gauge, and Progress charts are used to highlight a single metric or indicate how close the system is to a defined goal. |
|
• |
Radar and Polar Area charts can compare metrics like compliance ratings across multiple policies or departments. |
|
• |
World and US Geography charts help visualize endpoint distribution geographically for global and regional tracking. |
The widgets, once added to a dashboard, are removed from the Add Widget list to prevent duplication. However, some widgets can be added multiple times to a dashboard. If the widget is added to dashboard, you can still view it in the Add Widget list. You can add them again with different parameters (for example, grouping by different fields such as owner or priority).
The following is the list of widgets that can be added repeatedly:
|
1. |
Log in to the appliance System Administration Console, https://appliance_hostname/system, or select System from the drop-down list in the top-right corner of the page. Then click Reporting.
|
◦ |
If your appliance does not have the Organization component enabled, or if you want to access an organization-level report, log in to the appliance Administrator Console, https://appliance_hostname/admin. Or, if the Show organization menu in admin header option is enabled in the appliance General Settings, select an organization in the drop-down list in the top-right corner of the page next to the login information. Then click Reporting. |
|
3. |