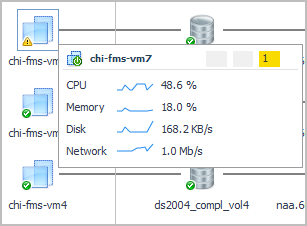
This workflow introduces you to the version of the Virtualization dashboards available in Foglight for Storage Management. For detailed information, see the VMware Monitoring in Foglight for Storage Management User and Reference Guide or Hyper-V Monitoring in Foglight for Storage Management User and Reference Guide.
|
1 |
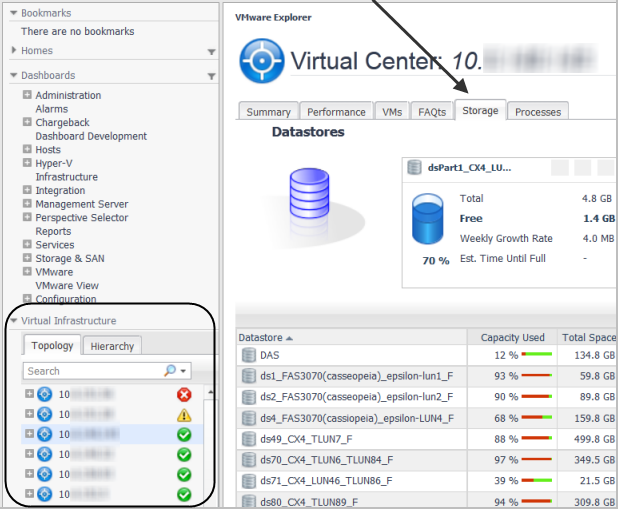
On the navigation panel, under Dashboards, click either VMware > VMware Explorer or Hyper-V > Hyper-V Explorer. |
|
TIP: If you do not see the menu, ask your Foglight for Storage Management Administrator to add the role VMware Administrator or Hyper-V Administrator to your user account. |
|
2 |
|
• |
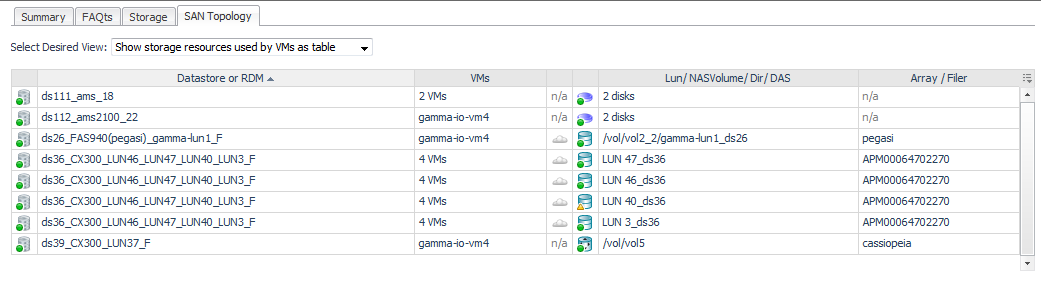
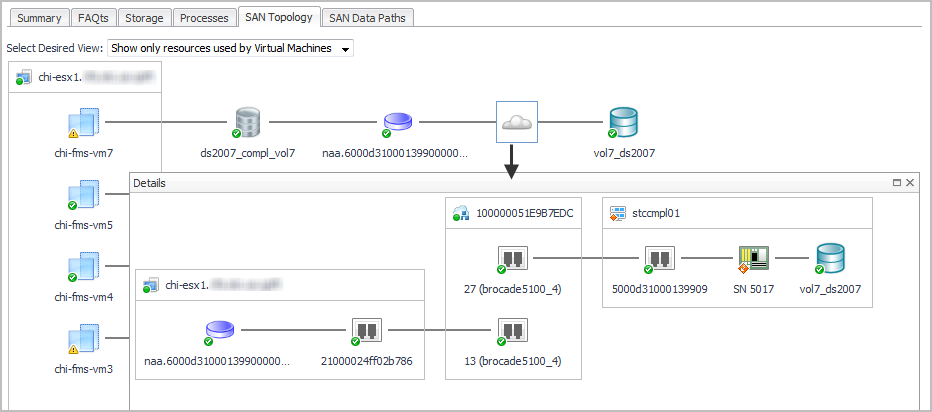
Click the SAN Topology tab. For instructions about this view, see Exploring Connectivity with SAN Topology Diagrams. |
|
• |
Click the SAN Data Path tab. For instructions about this view, see Exploring I/O Performance with SAN Data Paths. |
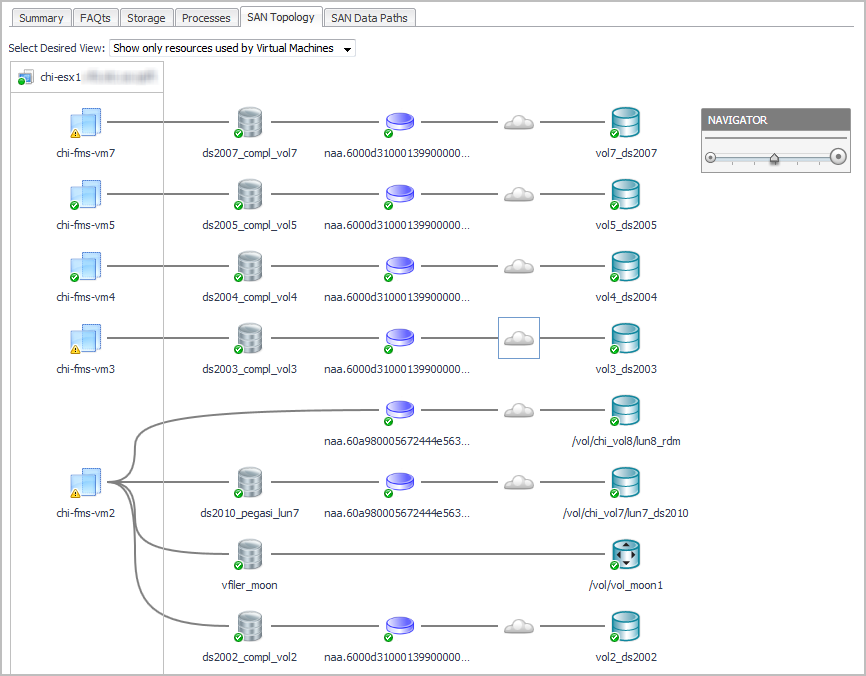
The following workflow explains how you can verify connectivity and the status of entities and storage devices in your infrastructure using a topology diagram. This procedure assumes that you navigated to a topology view from a Virtualization Explorer dashboard (see Introducing the Virtualization Dashboards) or from a Storage Explorer component dashboard (see Investigating a LUN or Investigating a NASVolume).
|
5 |
Click a Cloud |
This workflow walks you through using the SAN Data Paths tab from the VMware Explorer’s ESX Host dashboard. The content of the SAN Data Paths tab may be slightly different on the Virtual Machine, Datastore, and LUN dashboards, but the flow is the same. The workflow for Hyper-V servers, VMs, and CSVs is similar, but uses the Hyper-V terminology. This workflow continues from Introducing the Virtualization Dashboards.
|
1 |

|
• |
Datastore/Disk Extent. List of datastores and the disks that they use, ordered so that the datastores with high-latency disk extents appear at the top. Datastores configured from a NASVolume show only the associated volume; no other data is available. If an RDM or Other node is displayed, the disk extents under this node are RDMs providing storage directly to the virtual machine. |
|
• |
Latency. Average latency per operation. |
|
• |
Data Rate. Average data rate for I/O from the ESX or VM to the LUN. |
|
• |
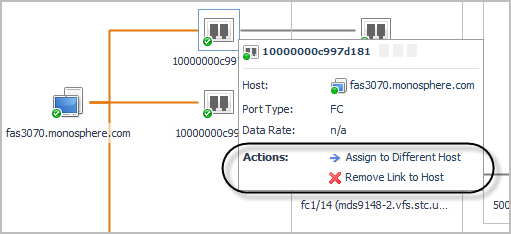
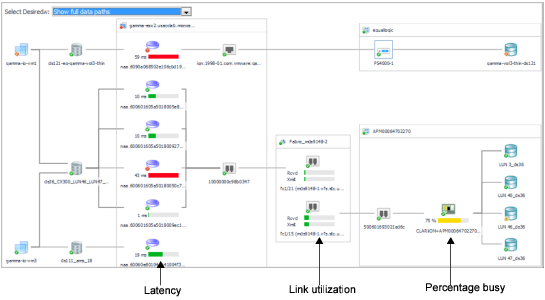
ESX FC Ports --> SAN Util. Displays the busiest link (read or write utilization) in the possible paths between the ESX and the FC switches. Click the cell to display all the port links. Review the topology diagram to see the ports and link utilization. Data is not available for IP ports. |
|
• |
SAN --> A/F Ports Util. Displays the busiest link (read or write utilization) in the possible paths between the FC switches and the array/filer ports. Click the cell to display all the port links. Review the topology diagram to see the ports and link utilization. Data is not available for IP ports. |
|
• |
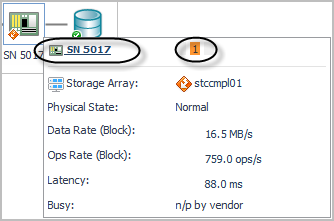
A/F Ctrl Busy. Displays the CPU % Busy metric for the busiest controller in the data path for a storage array or filer. % Busy values are not available on some devices. |
|
• |
LUN / NASVolume / Dir. Displays the LUN that is mapped to the extent, or displays the NASVolume (filers) or directory (Isilon arrays) providing the storage for a datastore. |
|
• |
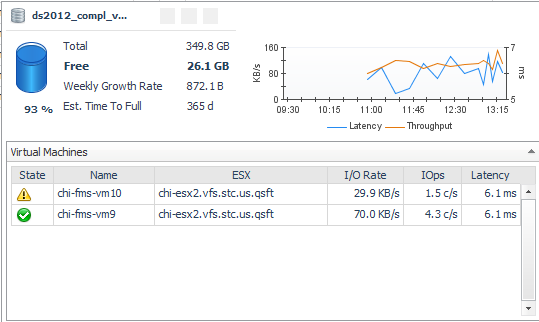
% Competing I/O at LUN. Displays the percentage of I/O being experienced by this LUN for all VMs accessing the Datastore, not just those in this ESX. Click the cell to display the top five VMs doing I/O to this LUN. |
|
• |
LUN State. Reports on the state of the LUN as follows: |
|
|
|
|
|
Indicates that the vendor does not provide % Busy or Latency metrics. |
|
|
|
• |
Latency (ms). Average latency per operation to the LUN during the time period. |
|
2 |
In the diagram, ensure that Select Desired View is set to Show full data paths. |
|
4 |
|
• |
|
• |
Latency: HPV:diskTotalLatency.[Warning, Critical, Fatal] |
|
• |
|
• |