Chat now with support
Chat mit Support

Foglight for Storage Management Shared 4.8.5 - User and Reference Guide

Getting Started Configuring Agents to Monitor Storage Devices
Brocade SAN Switches Cisco SAN Switches Dell Compellent Arrays Dell EqualLogic PS Series Array Groups EMC CLARiiON CX Series Arrays (CLI) EMC CLARiiON, VNX, or VMAX Storage Arrays (SMI-S) EMC Isilon EMC VPLEX Hitachi Data Systems AMS, USP, and VSP HP EVA Storage Arrays HP 3PAR Arrays NetApp Filers Configuration Procedures
Managing Agents Using Foglight for Storage Management Monitoring Storage Performance Investigating Storage Devices Investigating Storage Components Investigating VPLEX Storage Troubleshooting Storage Performance Managing Data Collection, Rules, and Alarms Understanding Metrics Appendix: Collection Target Support Matrix Online-Only Topics

Capacity Reports

The SanStorage Pools Capacity Summary Report summarizes the total and available capacity, and estimated time until full, for the pools or aggregates in the selected Storage devices. The report can be optionally limited to the pools or aggregates with thin-provisioned entities.

Low Capacity Rule

The rule StSAN E Pool Low Available Capacity with Email will be evaluated after every collection that provides new capacity information. A fatal alarm will be generated for every pool experiencing severe capacity pressure. A critical alarm will be generated for every pool experiencing high capacity pressure. A warning alarm will be generated for every pool included under the monitor count. No email will be generated for warning alarms.

The following registry variables are used in the pool capacity evaluations for alarm generation and for determining which pools are experiencing capacity pressure.

These variables are used in pool capacity evaluation to compare to the estimated Time Until Full. For over-committed pools, they will generate alarms as Fatal/Critical/Warning. For pools that are not over-committed, they will generate alarms as Critical or Warning, based on the available capacity in the pool.

There variables are used to examine pool capacity when no estimated Time Until Full value is available, and when the Time to Full is very long. Critical or Warning alarms will be generated for pools that are not over-committed. Fatal and Critical alarms will be generated if the pool is over-committed.

The value of these registry variables can be easily modified to meet the needs of your environment.

Storage Capacity tab

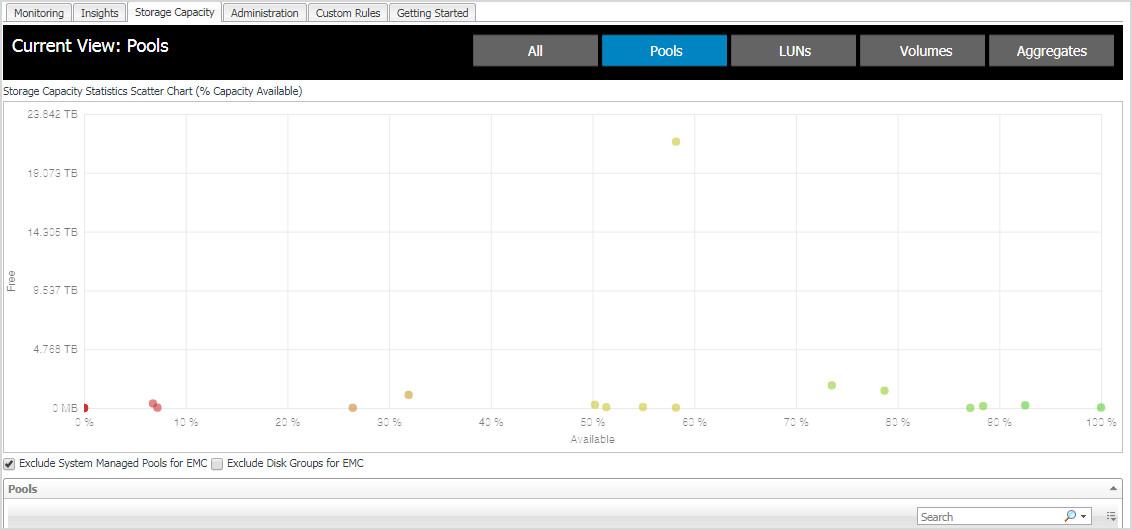
The Storage Capacity tab includes charts and tables for monitoring the capacity being used by the all devices, pools, LUNs, NASVolumes, or aggregates. Select what you want to monitor by clicking one of the following button at the top of the view: All, Pools, LUNs, Volumes, or Aggregates.

The middle part of the view includes the Storage Capacity chart, which shows the pools with the scatter chart that uses Free as Y axis and Capacity Available Percent as X axis.

The lower part of the view includes the Storage Capacity table, which displays the following information for the selected option (All, Pools, LUNs, Volumes, or Aggregates).

Name

Device name.

Click the name to open the device Summary tab.

Type

Device type.

Array/Filer

Array or filer name.

Time to Full

Time remaining until the maximum capacity is reached.

Health Score

Health score. For details about how health scores are calculated, see Pool and Volumes health scores.

Capacity Used (% Available)

Capacity currently used.

Free

Capacity currently available (free).

Total

Total device capacity.

Health scores are base on two criteria:

The code is in a derived metric, so that the heath scores are recalculated on the fly, whenever new data for a pool is submitted. The code works as follows:

Starting score: 75%

If long term (preferred) or short term predictive data is available, the starting score is reset:

< 14 days to full: set to 10%

< 28 days to full: set to 35%

< 84 days to full: set to 50%

> 300 days to full: set to 100%

> 200 days to full: set to 85%

> 100 days to full: set to 70%

From the starting score, the code adjusts the calculations based on the percent of free space available:

< 10%: score adjusted -30%

< 20%: score adjusted -20%

< 30%: score adjusted -10%

> 90%: score adjusted +30%

> 80%: score adjusted +20%

> 70%: score adjusted +10%

Any computed values over 100 are changed to 100%.

Any computed values < 0 are changed to 0%.

Trending data for volumes is not available yet. Therefore, the health score is currently based solely on the currently available capacity.

The code works as follows:

Starting score: 75%

From the starting score, the code adjusts the calculations based on the percent of free space available:

< 10%: score adjusted -30%

< 20%: score adjusted -20%

< 30%: score adjusted -10%

> 90%: score adjusted +30%

> 80%: score adjusted +20%

> 70%: score adjusted +10%

Any computed values over 100 are changed to 100%.

Any computed values < 0 are changed to 0%.

Creating Storage Reports

In the Storage Environment dashboard, you can create reports to share with colleagues. You can also copy and edit existing reports. If the Reports tab is not displayed, your Foglight for Storage Management Administrator may need to modify your user account to include the General Access role.

1
On the Storage Environment dashboard, click the Insights tab, and then click Reports.
The Create a Report wizard opens. Use the Next and Back buttons to navigate between pages.
2
Click Finish to generate the report.


Verwandte Dokumente

The document was helpful.

Bewertung auswählen

I easily found the information I needed.

Bewertung auswählen