Die Internet Explorer Versionen 8, 9 und 10 werden vom Quest Software Portal nicht mehr unterstützt. Wir empfehlen Ihnen, Ihren Browser auf die neueste Version von Internet Explorer oder Chrome zu aktualisieren.
Zum Upgraden auf Internet Explorer 11 hier klicken
Zum Upgraden auf Chrome hier klicken
Wenn Sie weiterhin Internet Explorer 8, 9 oder 10 verwenden, können Sie nicht alle unsere großartigen Self-Service-Funktionen in vollem Umfang nutzen.

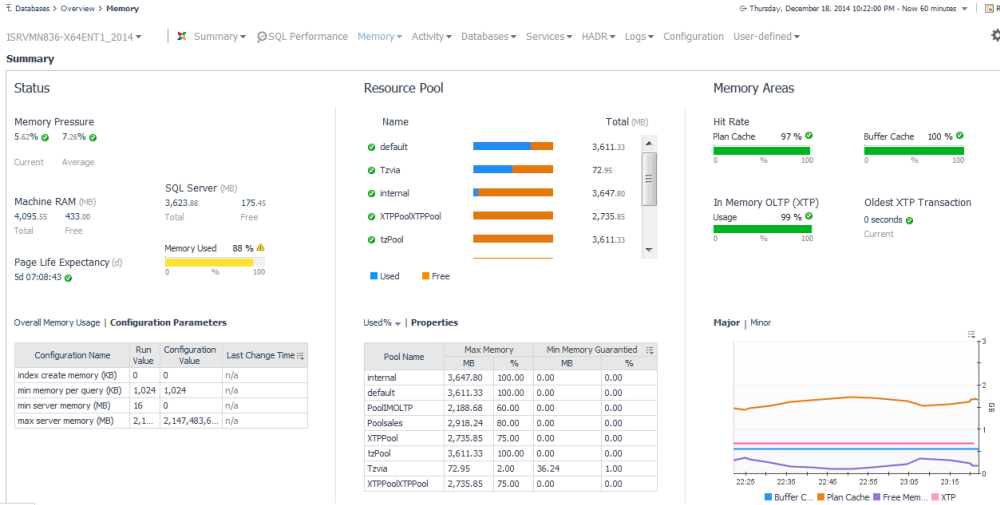 The Summary panel allows you to perform the tasks described in the following topics: