Chat now with support
Chat mit Support

Foglight for Java EE Technologies 5.9.7.5 - Application Servers User Guide

Monitoring Application Servers Monitoring Systems Monitoring Servers Monitoring Applications Monitoring Requests Managing Traces Using Object Tracking to Locate a Memory Leak Monitoring Methods Application Servers Monitor Views
JVM view Method Groups view Request Types view Entity EJBs view Message Driven EJBs view Stateful Session EJBs view Stateless Session EJBs view Deployed Applications view JSPs/Servlets components view Resource Adapters components view Web Applications components view Web Services components view .NET views JBoss Services views Oracle Services views Tomcat Services views WebLogic Services views WebSphere Services views JMX Administration dashboard JMX Explorer dashboard
Appendix: Regular Expressions

Applications table

Components and Deployment view

Figure 21. For example, for a WebLogic Application that has Stateless Session Beans, you can drill down to the instances by clicking the link Stateless Session, and then clicking the name Stateless Session on the health summary popup.
You can also view the properties for the selected application by clicking the Properties link at the far right of the Components and Deployment view.
An application server can have several versions of an application installed. A value of true indicates that the application is the active version (that is, the one that new sessions will use).
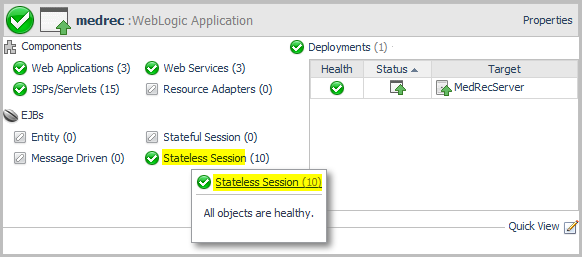
Quick View

The Quick View option provides condensed charts that show the general state of a selected system. These charts answer questions such as what are the JSP/Servlets with the most invocations, or what is the average pool usage for an EJB instance. The Quick View menu options available depend on the type of application server selected. The following table outlines the charts available for each application type.
1
On the navigation panel, under Dashboards, click Application Servers > Monitor. The Application Servers Monitor dashboard opens.
2
Click the Applications tile.
3
Click Quick View, or the edit icon beside the text.
5
Click OK to close the dialog box.

Monitoring Requests

The Application Servers Monitor dashboard includes predefined views for monitoring and investigating alarms associated with service requests made to your applications. Use the Requests view to investigate unique request types, such as requests made through HTTP, JMS, RMI, or JNDI, and to access full details of those request types. In addition, this interface allows you to investigate single traces in full detail or at component detail to assist you in localizing a potential trouble spot.
The Requests view shows performance information about a selected service request.
1
On the navigation panel, under Dashboards, click Application Servers > Monitor. The Application Servers Monitor dashboard opens.
2
Click the Requests tile.
Verwandte Dokumente

The document was helpful.

Bewertung auswählen

I easily found the information I needed.

Bewertung auswählen