Chat now with support
Chat mit Support

Foglight for DB2 (Cartridge) 5.9.7.20 - User Guide

Introduction to Foglight for DB2 LUW Using Foglight for DB2 LUW Reference
Dashboards and Views Collections and Metrics
CF Locks Collection CF Memory Pools Collection CF Resource Usage Collection Current Agents Details Collection Agents Summary Collection Current Locks Wait Collection Database Bufferpools Summary PS Collection Database Configuration Collection Database Tablespaces Collection Database Tablespaces Summary Collection Database Usability Collection Database Parameters Collection Database Instance Parameters Collection Database Instance Registry Variables Collection Database Tablespaces BP Collection FCM Activity Collection FS DB Storage Collection FS DB Storage Summary Collection FS Instance Storage Collection FS Storage Collection FS Storage Summary Collection General Activity Collection HADR Activity Collection Host Properties Collection OS General Collection Instance Activity Collection Instance General Collection Instance Nodes Collection Instance Usability Collection IO Activity Collection License Details Collection Log Activity Collection Log File Collection Log Message Collection Messages Count Collection Monitor Switches Collection OS DB2 General Process Collection Partition Tablespaces Summary Collection Partition Usability Collection pureScale Alerts Collection Top SQLs Collection Query Agents Details Collection Database Partition Activity Collection DB2 Partition Subcategories Wait Collection History Locks Wait Collection History Locks Summary Collection Instance Memory Collection Instance Memory Pool Collection Instance Memory Summary Collection Instance Memory Total Collection Database Memory Collection Database Memory Pool Collection Database Memory Pool DB Collection Database Memory Summary Collection Database Memory Total Collection Database Buffer Pools Collection Database Tables Collection Database Partition Backup Collection Database Tables Global Collection Database Applications Collection

Database Environment Tiles

The Database Environment tiles display a high-level overview of your database environment. There is a tile for each type of database currently monitored by Foglight: All Instances, SQL Server, Oracle, Sybase, and DB2. Each tile shows how many of the corresponding object instances there are in your database infrastructure, and the count of objects of that type in each of the alarm states (Normal, Warning, Critical, Fatal).

Clicking the object type icon, the object type name, or the object count, shows summary information for that object type in the Databases Instances View. Clicking an alarm state (for example, Warning) on a tile displays summary information in the Databases Instances View for the objects in the selected state.

Alarm counts. The total counts of alarms associated with the database instances, broken down by alarm types (Normal, Warning, Critical, Fatal).
Database instance count. The number of the DB2 database instances in your environment.

Drill down on:

Alarm counts. Lists the database instances against these alarms generated in the Databases Instances View.
Database instance count. Displays all DB2 database instances in the Databases Instances View.

Databases Instances View

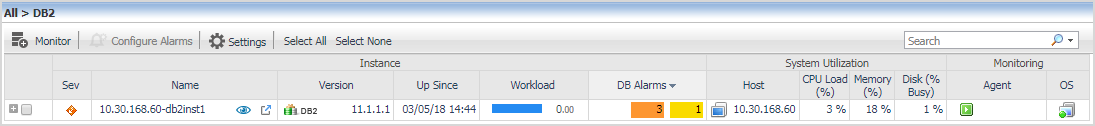
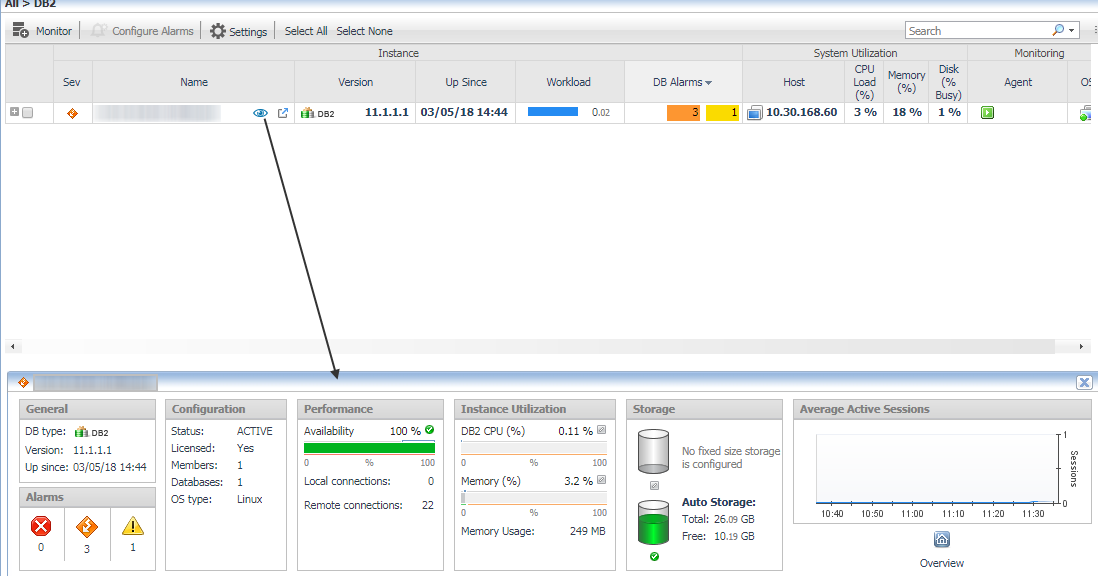
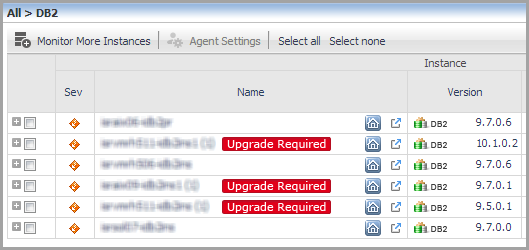
The Database Instances view displays a list of database instances. It displays all available database instances, or a filtered list. For more information about possible filters, see Instance home page .


Database, Sev. The DB2 database instance’s highest severity alarm, used in Foglight to determine the instance’s health state.
Database, Name, Version, and Up Since. The name and version number of the database instance, and the date and time when the database instance was last restarted.
NOTE: If the Name column contains the note Upgrade required, the agent package is not re-deployed to the Foglight Agent Manager instance following the cartridge upgrade.
Database, Workload. The workload graph for the DB2 database instance.
Database, Alarms. The number of Warning, Critical, and Fatal alarms for the DB2 database instance. The alarms are displayed by their severity levels, with the aggregated number for each severity.
System Utilization, Host. The name of the computer on which the DB2 database instance is running.
System Utilization, CPU Load (%). The overall operating system CPU usage.
System Utilization, Memory (%). The amount of memory consumed by all OS processes (including the DB2 instance process). It includes both RAM resident memory and swapped memory.
System Utilization, Disk (% Busy). The percentage of time the busiest device spent serving system-wide I/O requests. This metric serves as a measure for the system I/O load.
Monitoring Status, Agent. The operational status of the monitoring agent. When the agent instance is running, hovering over the icon in the State column displays the status message Collecting Data.

When the agent instance is running but not collecting data, hovering over the State icon displays one of the following status messages:

Monitoring Status, OS. Indicates whether Foglight for DB2 LUW is monitoring the instance’s operating system.

Drill down on:

Database Alarms. Display the Outstanding Alarms dialog box.

The pop-up shows the most recent alarms generated for the specific database instance. To view additional information about an alarm, click its entry in the Sev column. The Alarm dialog box appears, showing details about the selected alarm.

For complete information about alarms in Foglight, see the Foglight User Help.

Database Cue Card

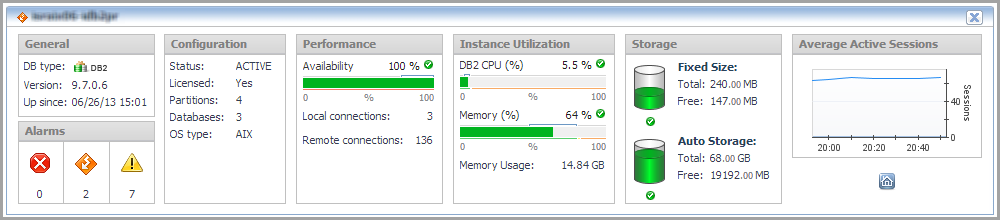
The Database Cue Card displays details about a database instance selected in the Databases Instances View.


Alarms, . The number of Critical alarms associated with the selected database instance.
Alarms, . The number of Warning alarms associated with the selected database instance.
Alarms, . The numbers of Fatal alarms associated with the selected database instance.
General, DB type. Specifies the type of the monitored database instance: DB2.
General, Version. Version number of the DB2 database.
General, Up since. How long the instance has been up and running.
Configuration, Status. If the instance is configured or not.
Configuration, Licensed. If the instance is licensed or not.
Configuration, Members. Number of members in the instance.
Configuration, Databases. Number of databases in the instance.
Configuration, OS type. Operating system type.
Performance, Availability. Availability of the instance in percent.
Performance, Local connections. Number of local connections.
Performance, Remote connections. Number of remote connections.
Instance Utilization, DB2 CPU(%). Percentage of the CPU used by DB2.
Instance Utilization, Memory (%). Percentage of the memory used by DB2.
Storage, Fixed Size. The total and free amount of fixed storage in MB.
Storage, Auto Storage. The total and free amount of auto storage in MB.
Average Active Sessions. The average number of active sessions compared to the time of those sessions.

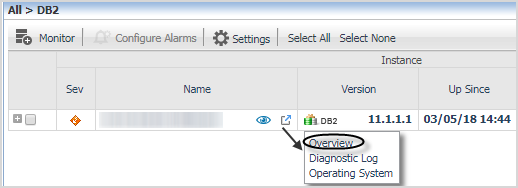
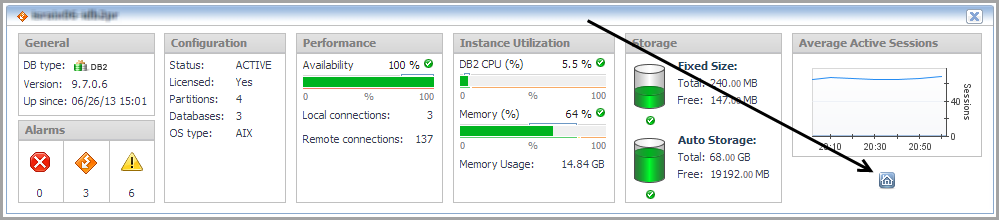
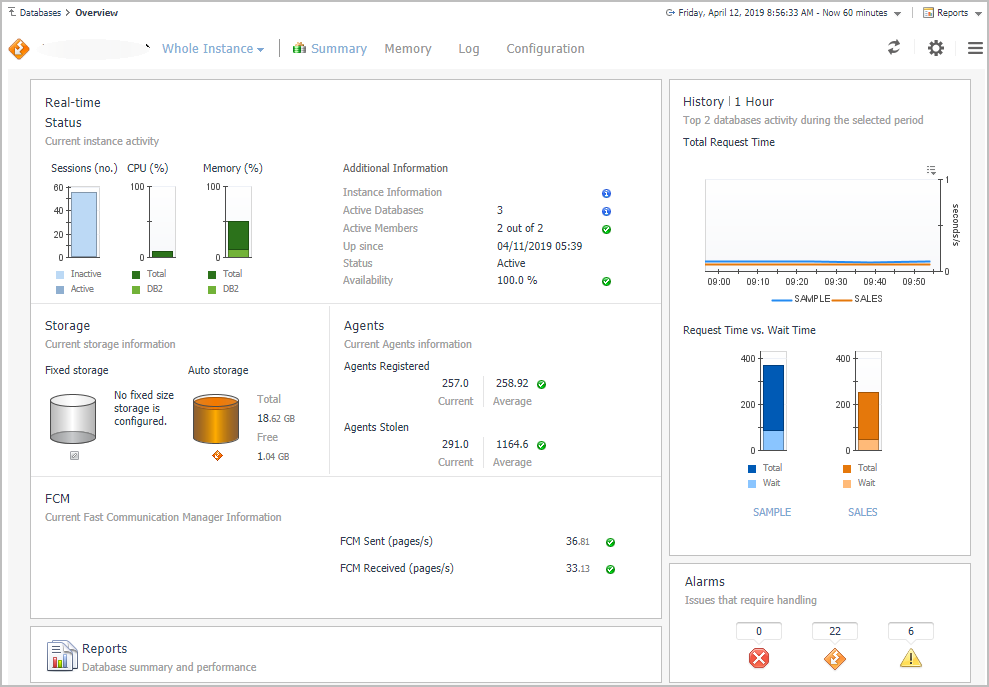
Clicking the Overview icon in the lower right corner takes you to the Instance home page.

Instance home page

The Instance home page provides metrics on the overall status of the selected instance.

Verwandte Dokumente

The document was helpful.

Bewertung auswählen

I easily found the information I needed.

Bewertung auswählen