The Web Server Details view provides information about the monitored web server as well as detailed information about web server performance and web site performance on the Performance tab and Web Sites tab respectively.
You can drill down to this view by clicking a web server name on the Summary – All Apache Web Servers view, or by clicking Explore on the Summary – <WebServerName> view.
|
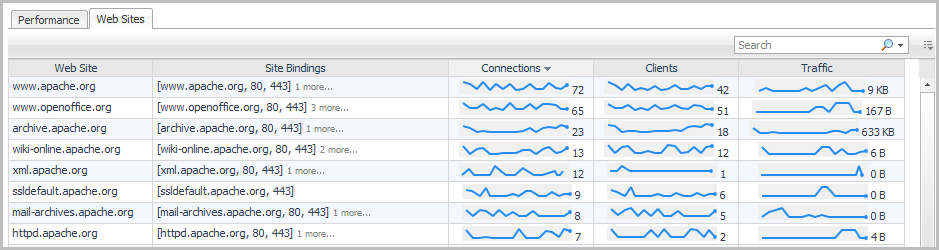
If the Apache web server has been configured using the Listen directive to listen for incoming connections on specific ports or selected addresses (or both), that binding information appears here. | |
|
The process name is either httpd (for Apache versions 2.2 and 2.4) or Apache (for versions 1.3 and 2.0). | |
|
The total number of times the web server was accessed since the last time it was restarted. | |
|
The total amount of traffic (bandwidth used) by the web server since the last time it was restarted. |
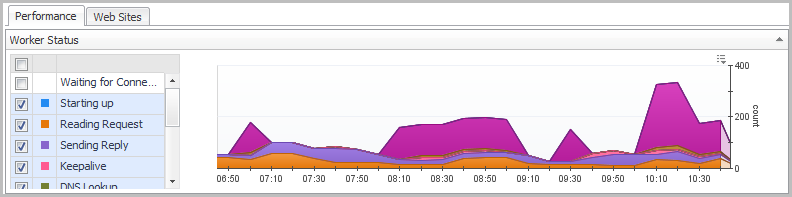
By default, all status types except Waiting for Connection and Open slot with no current process are selected and shown.
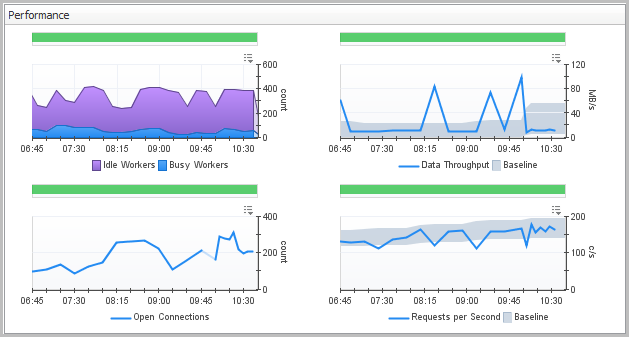
The Data Throughput and Requests per Second charts include a baseline envelope that enables you to quickly see when values are above or below the typical operating range. For more information about baselines, see Analyzing Activity Levels with IntelliProfile in the Foglight Administration and Configuration Guide.
|
• |
On the Web Server Details view, click the Web Sites tab. |
|
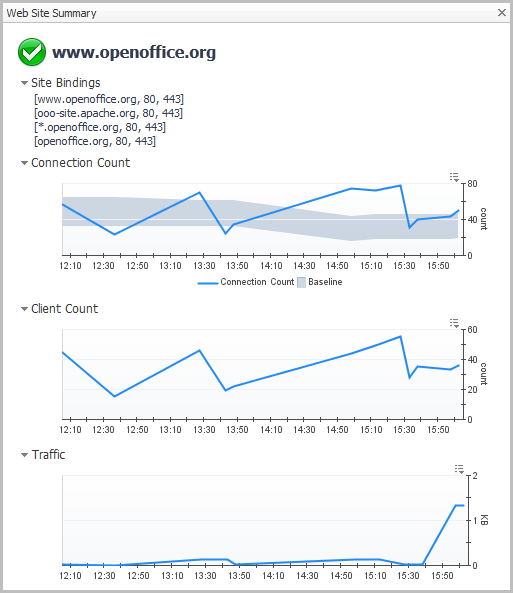
If the Apache web server has been configured using the Listen directive to listen for incoming connections on specific ports or selected addresses (or both), that binding information appears in this box. | |
Click any row in the table to open the Web Site Summary view for the selected web site.