Reports
|
• |
Name—report name. |
|
• |
Date—date the report was last run. |
|
• |
Last run—report format the report was last run in, PDF, Excel, XML. |
|
• |
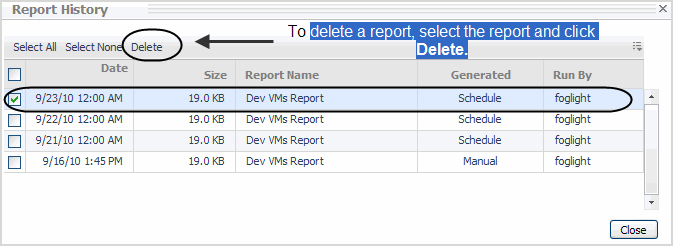
History—clicking on a report shows the Report History and the complete run history of the report. Click Delete to remove a report. |
|
• |
Schedule—when the report is scheduled to run. |
|
• |
Run Now—clicking this icon displays the Run Now tool tip and the report runs. After run completion, you can download the report for viewing. |
|
• |
Template—the current report template selected. |
To delete scheduled reports, use the checkboxes in the Reports view to select the report. Click the Delete button at the top of the view.
Administration Tab
For details on using the Administration view, see the Foglight™ for VMware Virtualized Environments User and Reference Guide or the Foglight for Hyper-V User and Reference Guide.
Capacity Management Tab
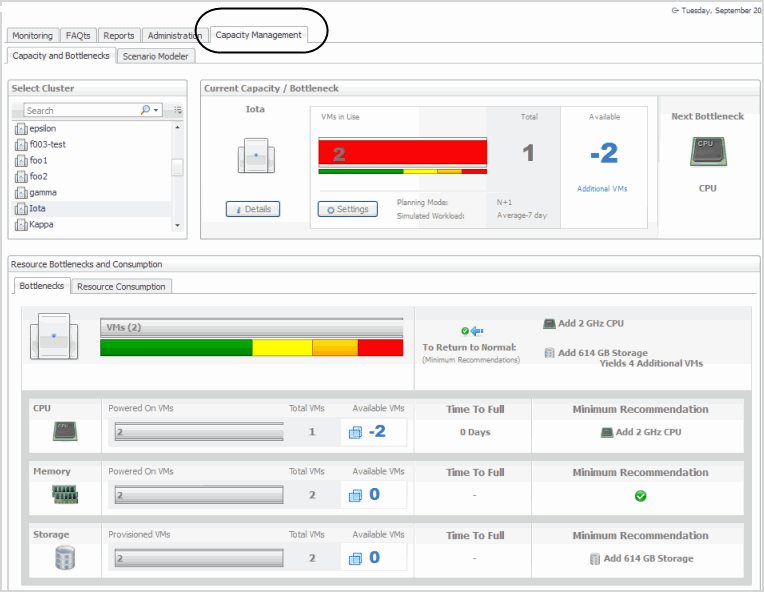
The Capacity Management view in Hyper-V Environment allows you to view detailed capacity management graphs/metrics and create capacity management scenarios. For the information about using Foglight for Capacity Director in a VMware Environment, see the Foglight for Capacity Director User Guide.
The Capacity Management view provides the following tabs:
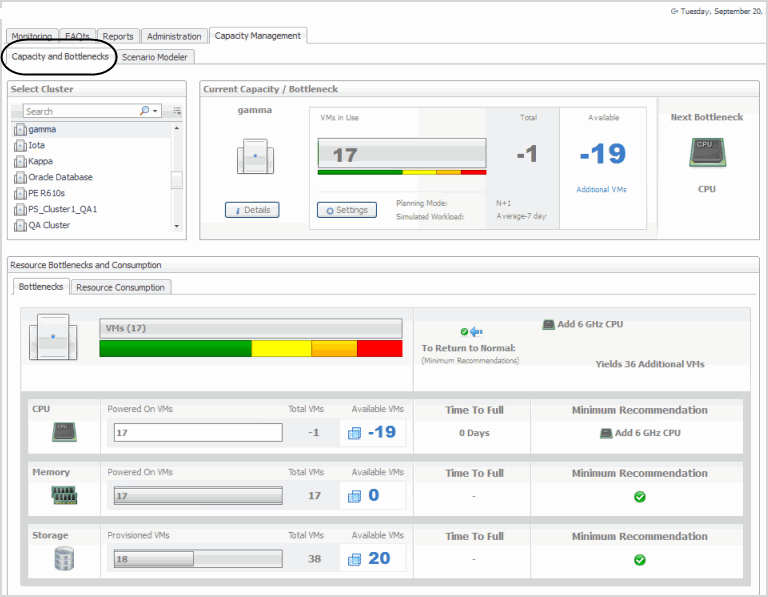
Capacity and Bottlenecks
This tab displays the following sections:
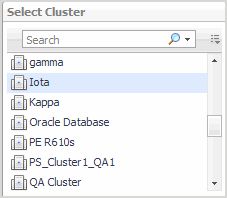
Use this view to search for and select clusters you want to view capacity management details on.
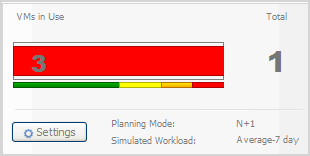
Selecting a cluster in this list populates the adjacent Current Capacity/Bottlenecks view.
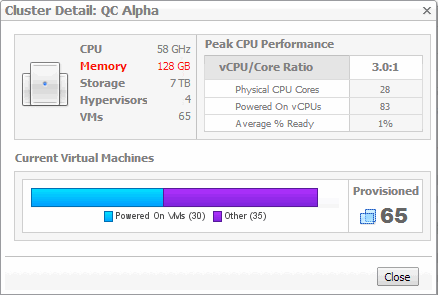
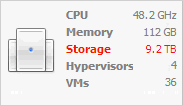
The Cluster Detail dialog box displays additional metrics about the selected cluster and its current configuration. To display it, in the Current Capacity/Bottleneck view, click Details.
|
Allows you to examine n more detail the virtual CPU and core ratio details. | |
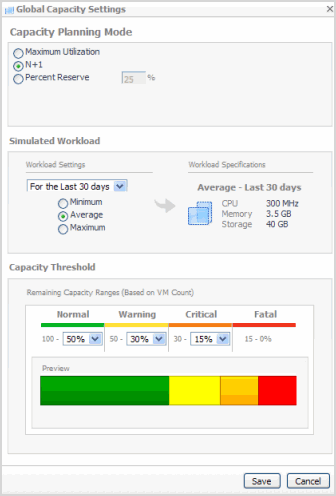
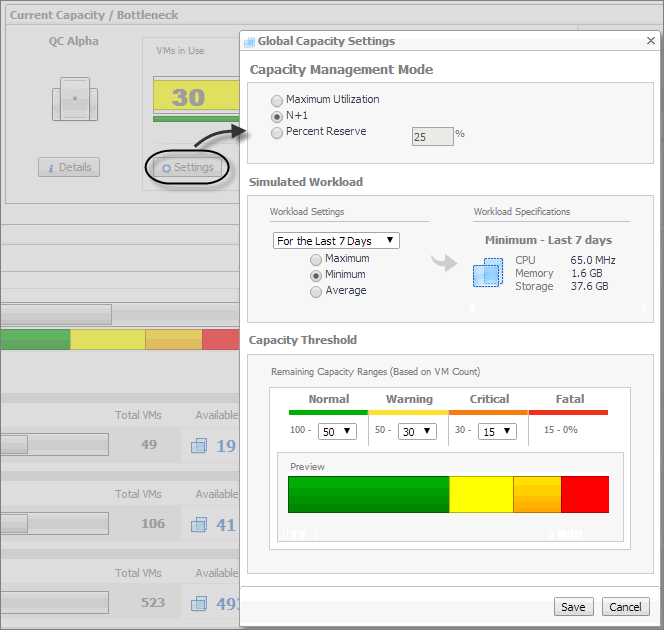
The Global Capacity Settings dialog box allows you to configure utilization, simulated workload, and capacity thresholds of a cluster. These settings apply to all clusters. To display it, in the Current Capacity/Bottleneck view, click Settings.
|
A simulated workload represents a typical virtual machine running on the cluster. The Simulated Workload area allows the system to capture the characteristics of a typical virtual machine used to simulate virtual machine workloads on the cluster. The simulated workload represents whatever resources that a common or typical virtual machine uses within this environment. | ||
|
Displays the a typical set of resources needed to allocate to a virtual machine, given the supplied Workload Settings. The displayed values are used to calculate the Available VMs counts on the Bottlenecks Tab. | ||
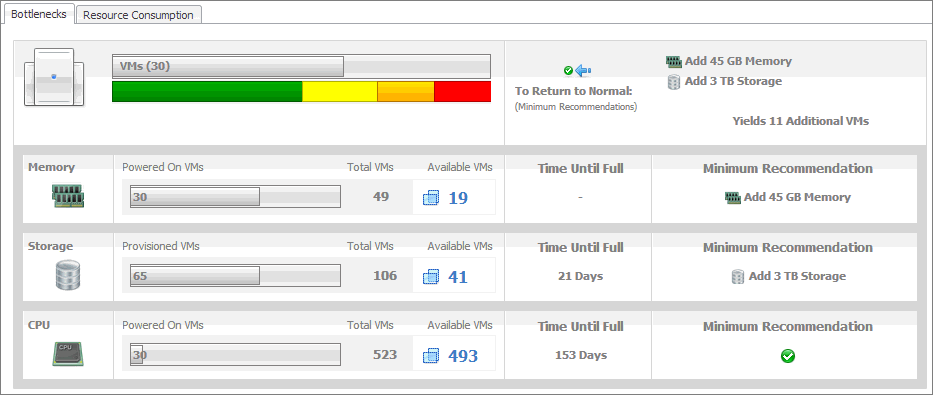
This tab displays a detailed view of the resource constraints for the selected cluster.
| ||||||||
|
Each resource row (Memory, Storage, and CPU) shows a visual representation of the powered on virtual machines relative to the total number of virtual machines that are considered available based on the levels of used resources. The levels of usage for each resource, gives you a good indication of what can limit the cluster’s overall capacity, allowing you to target only specific upgrades to achieve desired capacity. | ||||||||
|
The number in the graph is the number of powered on virtual machines, compared to the Total VMs value. | ||||||||
|
The number of powered on virtual machines (Powered on VMs or Provisioned VMs) plus the number of available virtual machines (Available VMs). | ||||||||
|
The number of available virtual machines, as calculated using the Global Capacity Settings (see page 21). It is the total memory capacity minus the Amount Reserved and minus the amount of memory currently in use. | ||||||||
|
The recommended amount of resources that need to be added to the cluster to bring the cluster to the Normal state. It represents the amount obtained using the following formula: - Resource Capacity + Amount Reserved + Normal Capacity + Resource Used If the recommended amount is less than zero '0', a green check mark is displayed. | ||||||||
|
Determined by the Capacity Management Mode (see page 22):
| ||||||||
|
Calculated using this formula: (Resource Capacity – Amount Reserved) * Capacity Threshold Normal Value | ||||||||
This tab consists of the following views:
|
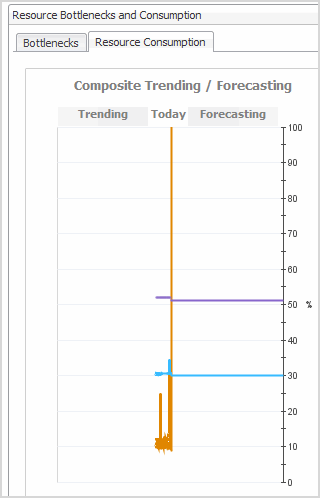
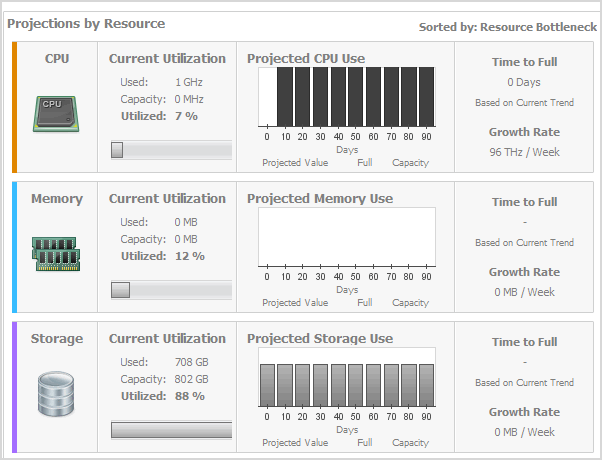
Forecasted levels of resource usage, for the next three months, based on historical data. |
The colors to the left of the resource icons match the lines plotted on the Composite Trending/Forecasting chart appearing to the left of this view. For more information about this chart, see page 24.
|
The total amount of resources in the selected cluster, including the amount of resources currently in use (Used) and the remaining available resources. | ||
|
The percentage of total amount of resources (Capacity) that are currently in use. | ||
|
The projected resource usage growth rate, based on the last seven days of observed values. | ||


