Chat now with support
Chat mit Support

Foglight for Microsoft DOT NET 5.9.13 - Application Servers User Guide

Monitoring Application Servers Monitoring Systems Monitoring Servers Monitoring Deployed Applications Monitoring Requests Managing Traces Using Object Tracking to Locate Memory Leaks Monitoring Methods Application Servers Monitor Views
JVM view Method Groups view Request Types view Entity EJBs view Message Driven EJBs view Stateful Session EJBs view Stateless Session EJBs view Deployed Applications view JSPs/Servlets components view Resource Adapters components view Web Applications components view Web Services components view .NET views JBoss Services views Oracle Services views Tomcat Services views WebLogic Services views WebSphere Services views JMX Administration dashboard JMX Explorer dashboard
Appendix: Regular Expressions

Aggregated Traces table

The Aggregated Traces table, on the top right side of the view, lists a series of aggregate traces over the time period for the selected requests. Aggregate traces are created using the aggregate time interval, which is set to one (1) hour by default. They contain information about all the traces collected within the aggregate time interval, and are useful for investigating a group of single traces all at the same time. Aggregate traces are identified by the start time of the aggregation. There is only one aggregate per interval.

Single Traces table

The bottom right side of the Traces view contains data related to the single trace selected in the Traces table. This table is the list of individual single traces. Clicking a time listed in this table displays the Single Trace view.

Performance charts

The Charts area contains graphs of the execution time and performance data for the selected single trace over the selected time period.

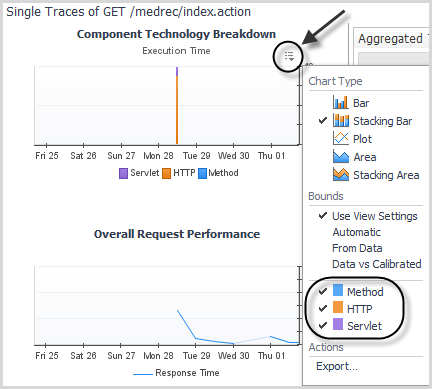
The graph displays the Execution Time spent in each component technology (for example, Servlet, RMI Outgoing, HTTP, .NET Method, or ADO) for the aggregated traces.

There are three types of breakdowns:

Viewing breakdowns

Breaking down the execution time by component technology and/or tier allows you to visualize the relative performance and breakdowns of all traces in a set. You can show the amount of time spent in each component of the application server for every trace in a set (aligned by time), and which servers each trace crossed. This is helpful when you have defined custom components to track a set of packages and classes.

Selecting any number of these custom components and tiers displays the average execution time in the Aggregated Traces table and the total execution time for a component technology and tier in the Single Traces table. You can also see breakdowns in chart form for a given request type.

1
In the Traces view, click the customizer icon beside the table you want to modify (either Aggregated Traces or Single Traces). The Show columns menu opens.
3
Click Apply.
Verwandte Dokumente
Showing 1 to 4 of 4 rows

The document was helpful.

Bewertung auswählen

I easily found the information I needed.

Bewertung auswählen