Using the Listview
Using Linked Reports
|
2 |
Select the filters and click Apply Filters. |
Viewing Report Information
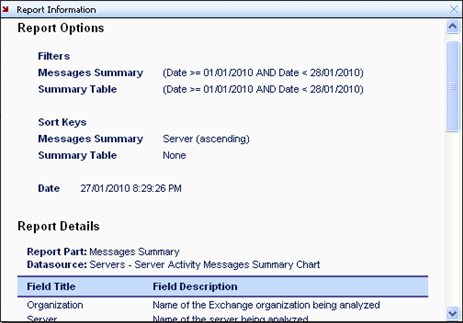
The following illustration shows an example of report information:
The following information is available:
|
• |
Report Options include default filters and sort keys, as well as any quick filters and sort keys you selected using the Quick Filter options. |
|
• |
Report Details include a list of the report parts (tables and graphs) that comprise the report. This section also shows a list of the data sources and all the fields (and the field descriptions) that are used. |
For information about custom reports, see Creating Custom Reports . For information about custom graphs, see Creating Custom Graphs .
Configuring Report Parts
|
1 |
|
3 |
Select a part in the Configured Parts pane and click Configure to select the settings for each part. |
|
a |
|
5 |
Click OK to generate your report. |
|
1 |
|
3 |
Click OK to generate your report. |


