This section describes what a user sees when they are invited to access Nova.
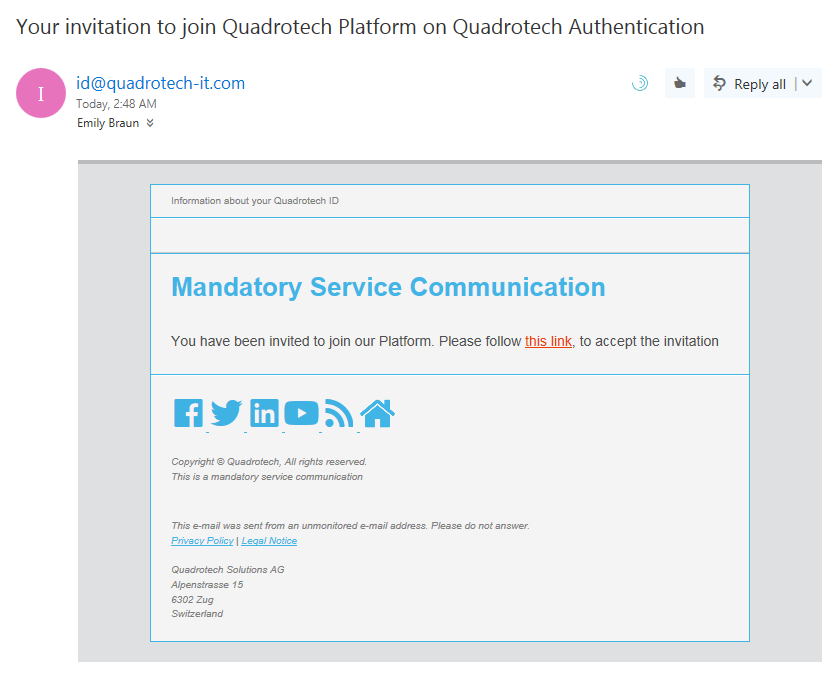
First, the user receives an email invitation that looks similar to this:
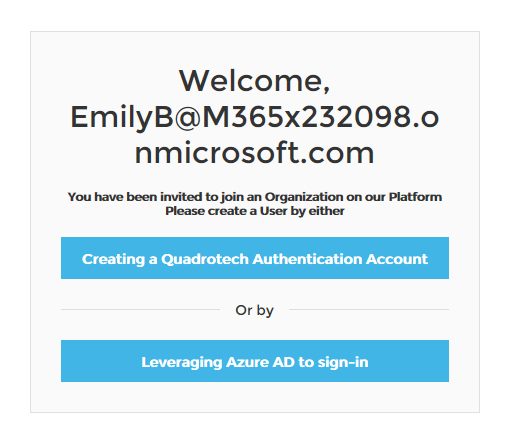
When they click the link in the email, they are prompted to create a user account:
Here is more about the options to create a user account:
·Creating a Quest Authentication Account: Create credentials that are unique to their Nova/Quest account.
·Leveraging Microsoft Entra ID to sign in: Use Microsoft Entra ID credentials to access Nova.
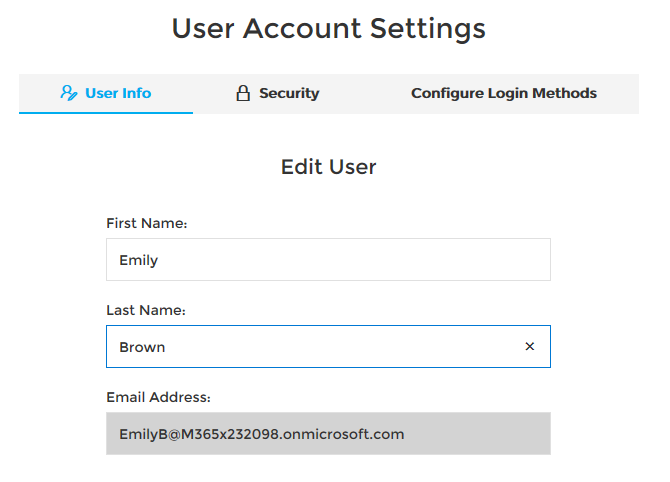
Finally, the user might be asked to enter/confirm their name:
There are several types of license that can be added to give access to features and services within the product. The Nova System Administrator for your tenant can see the licenses which are assigned, as well as the roles relating to individual users.
This is an example of a screenshot of what the Nova System Administrator might see:
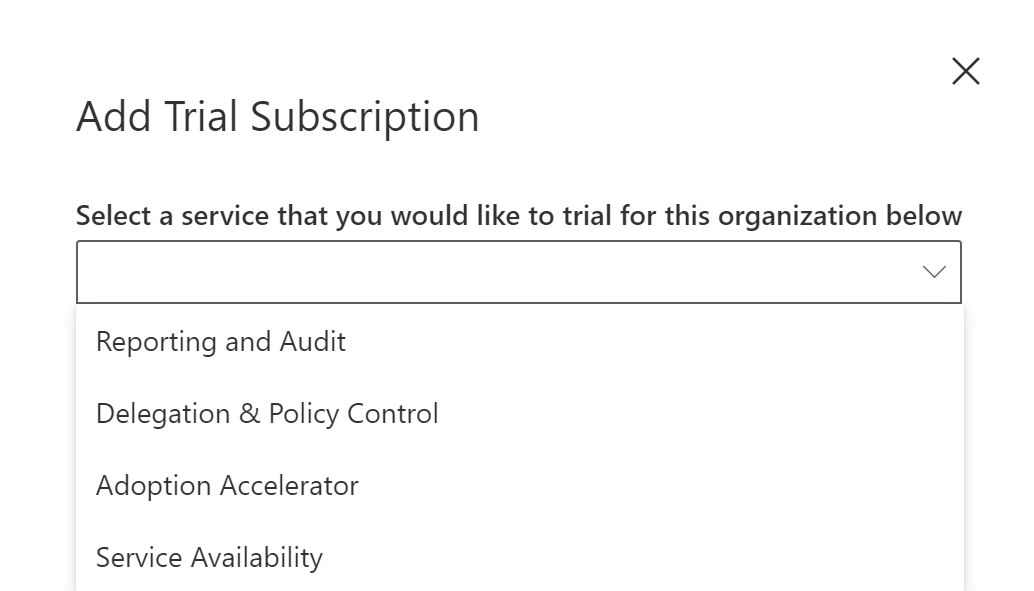
Types of license
The available licenses are as follows:
Delegation and Policy Control
This gives access to the Delegation & Policy Control areas of Nova. It allows administrators to create and manage policies, as well as delegated administrators to perform actions according to those policies, such as changing an end-user password, adding an out-of-office message and so on
Reporting and Audit
This gives access to the reporting areas of Nova including pre-built reports and the Report Center.
Requirements
The following are the requirements for the Nova on-premises agent:
·The Microsoft Graph module for Windows PowerShell must be installed on the machine where you will install the on-premises agent. This can be done via PowerShell with Install-WindowsFeature -Name RSAT-AD-PowerShell
·It must have 443 access to the Nova URL for the tenant. (This is called the endpoint address)
·It must be installed on a domain joined server. The server will need to have outbound ports 443 and 44388 open to the Autopilot application IP.
·It must have a service account that has Domain Admin rights in Microsoft Entra ID for each domain in the forest that the agent will manage. This is used for proxied administration.
·Service Account must be member of following groups in domain:
CN=Administrators,CN=Builtin
CN=Domain Admins,CN=Users
CN=Enterprise Admins,CN=Users
·The service account must have logon as service rights on the server.
·The agent must have a current .Net framework installed, as well as PowerShell 5.1 or above.
To obtain and install the agent:
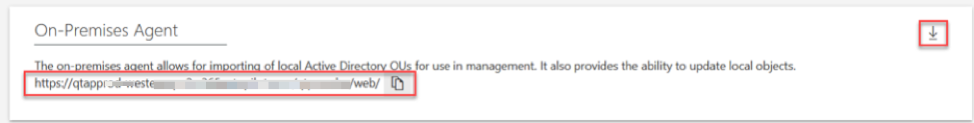
1.Go to the On premises agent page.
2.Ensure that the web services URL is copied and saved, it will be used during the installation:
3.Download the agent
4.Run the installation, and follow the prompts.
|
|
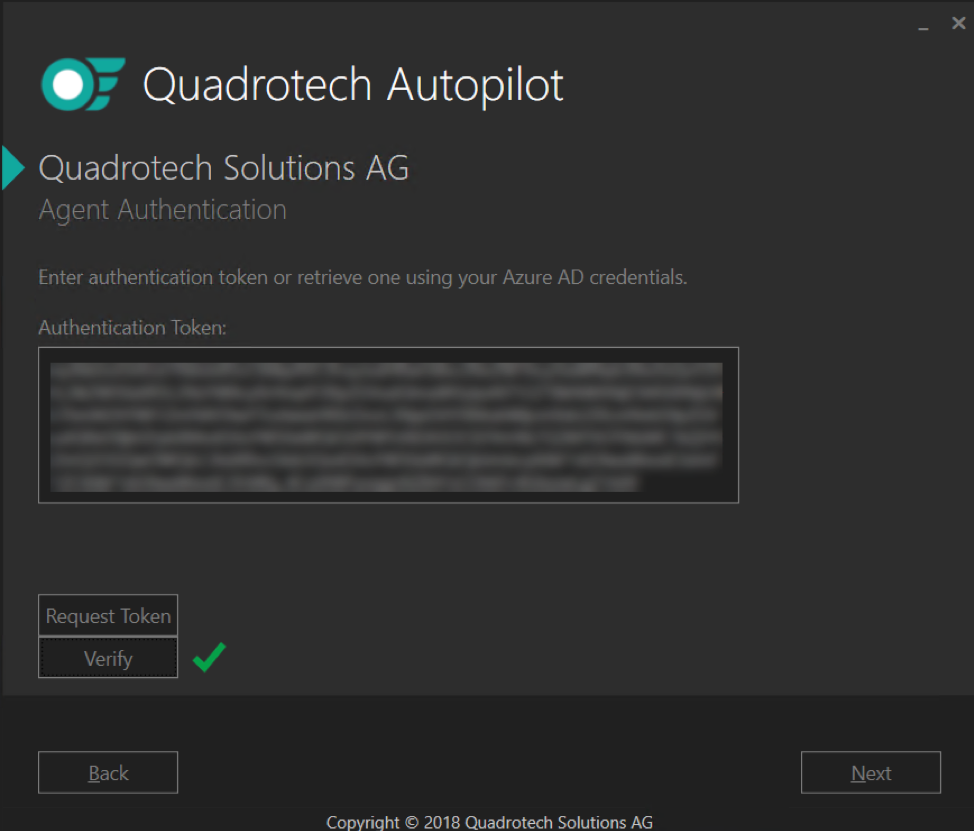
NOTE: During the installation you will request a token on the following screen: When prompted for an account to connect with, use the same Global Admin account which was used for the Service Account. |
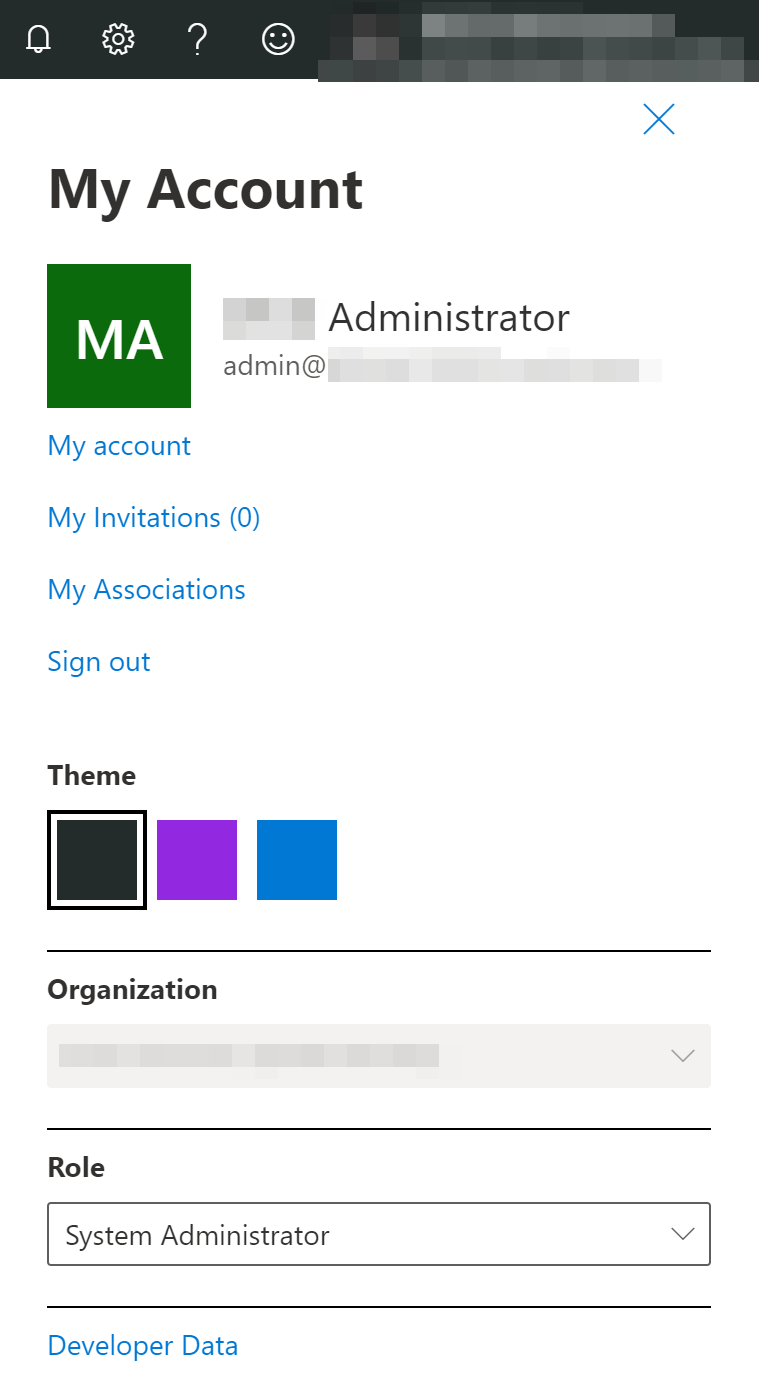
The Persona menu allows a user to see information about their Nova settings, their account, language and chosen color scheme. It also shows the current role and organization, and allows a user to switch to other roles and other organizations.
To access the Persona menu a user clicks on their name at the top right of the Nova user interface, and the menu will appear:
If a new role or organization is selected the user interface will switch, and jump to that chosen role and organization. For more on roles, click here.
Nova remembers which tenant and role a user was last using, so the next time that user logs into Nova it takes the user back to the same place. This happens across browsers, and across sessions.
Sometimes when you log in to Nova, you may not see quite what you expect. For example, you may see users listed on the Users page that you do not immediately recognize.
If this happens, you will want to check your Persona Menu. It could be that the last time you logged in, you switched your role, or switched your organization, or switched your role and organization. Nova remembers those changes between sessions.