Chat now with support
Chat mit Support

Foglight for vCloud Director 6.0.0 - User Guide

Getting Started Setting Up Monitoring Agents Investigating Resource Consumption Levels Investigating Object Dependencies Reference

Exploring the Collective Use of All Organization, Organization vDC, or Provider vDC Resources

The following views display the levels of resource utilization for all organizations, organization vDCs, or provider vDCs objects:

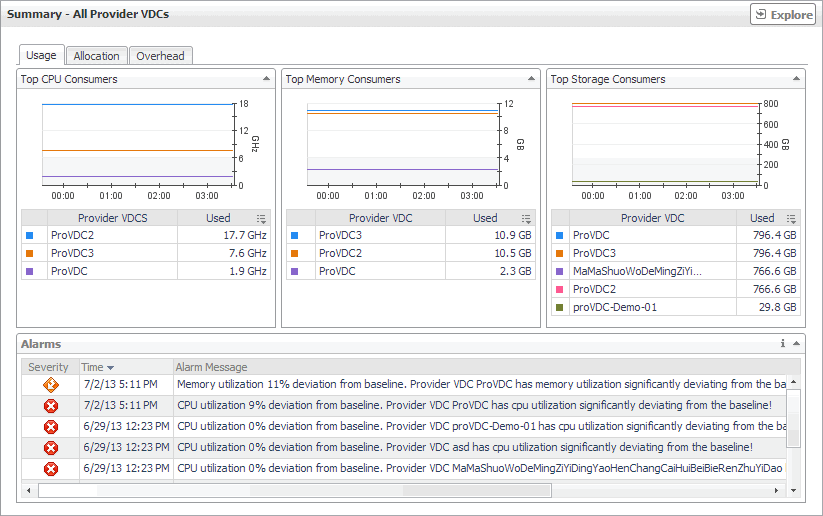
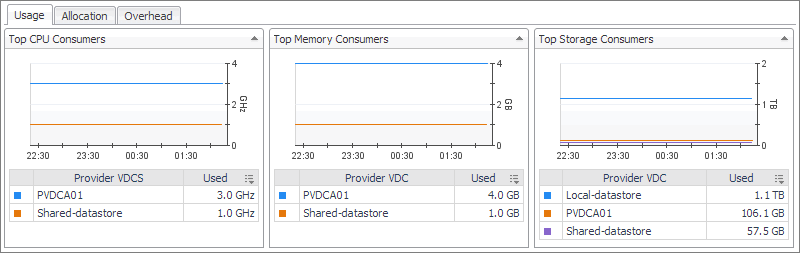
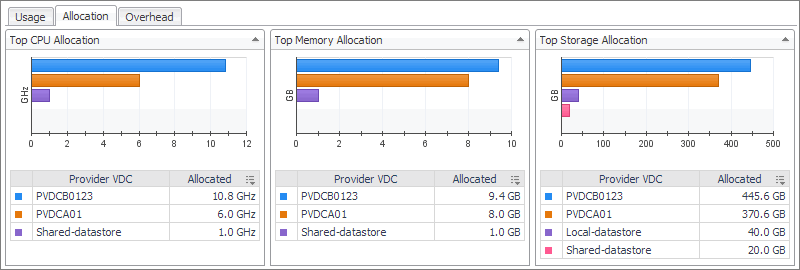
These views identify the elements that consume the highest amount of system resources. They can help you learn about the resource levels used by all organizations, organization vDCs, or provider vDCs in your environment, and to identify and prevent potential bottlenecks by reallocating resources where they are most needed. These summary views appear on the right of the Quick View when you select the Organization, Organization vDCs, or Provider vDCs tile.

Figure 15. Summary view

The information appearing on this view is organized into the following tabs:

For information about the All Alarms view also appearing in this summary, see Managing Alarms .

Usage tab

Use this tab to identify the organizations, organization vDCs, or provider vDCs with the highest usage of CPU, memory, and disk resources. The information appearing on this tab can help you to quickly identify the objects whose usage exceeds projected expectations. In most cases, allocating additional resources to these components can help avoid potential bottlenecks.

Figure 16. Usage tab

For each of the identified organizations, organization vDCs, or provider vDCs, the graphs and tables appearing on this tab display the following information. Foglight for vCloud Director populates these tiles using the values stored as metrics collected from monitored organizations, organization vDCs, and provider vDCs.

Table 4. Usage tab

The amount of CPU resources used by an organization, organization vDC, or provider vDC

VMVCloudOrganization cpuUsed

VMVCloudOrganizationVDC cpuUsed

VMVCloudProviderVDC cpuUsed

The amount of memory used by an organization, organization vDC, or provider vDC

VMVCloudOrganization memoryUsed

VMVCloudOrganizationVDC memoryUsed

VMVCloudProviderVDC memoryUsed

The amount of disk space used by an organization, organization vDC, or provider vDC

VMVCloudOrganization storageUsed

VMVCloudOrganizationVDC storageUsed

VMVCloudProviderVDC storageUsed

Allocation tab

Use this tab to identify the organizations, organization vDCs, or provider vDCs with the highest amounts of CPU, memory, and disk resources allocated to them. The information appearing on this tab can help you to quickly identify the objects that may require additional resources allocated to them in order to avoid potential bottlenecks.

Figure 17. Allocation tab

For each of the identified organizations, organization vDCs, or provider vDCs, the graphs and tables appearing on this tab display the following information. Foglight for VMware populates these tiles using the values stored as metrics collected from monitored organizations, organization vDCs, and provider vDCs.

The amount of CPU resources allocated to an organization, organization vDC, or provider vDC

VMVCloudOrganization cpuAllocated

VMVCloudOrganizationVDC cpuAllocated

VMVCloudProviderVDC cpuAllocated

The amount of memory allocated to an organization, organization vDC, or provider vDC

VMVCloudOrganization memoryAllocated

VMVCloudOrganizationVDC memoryAllocated

VMVCloudProviderVDC memoryAllocated

The amount of disk allocated to an organization, organization vDC, or provider vDC

VMVCloudOrganization storageAllocated

VMVCloudOrganizationVDC storageAllocated

VMVCloudProviderVDC storageAllocated

Overhead tab

Use this tab to identify the organizations, organization vDCs, or provider vDCs with the highest amounts of memory overhead. The information appearing on this tab can help you to quickly identify the objects that may require additional memory resources in order to avoid potential bottlenecks.

Figure 18. Overhead tab

For each of the identified organizations, organization vDCs, or provider vDCs, the graph and table appearing on this tab display the following information. Foglight for VMware populates these tiles using the values stored as metrics collected from monitored organizations, organization vDCs, and provider vDCs.

Table 6. Overhead tab

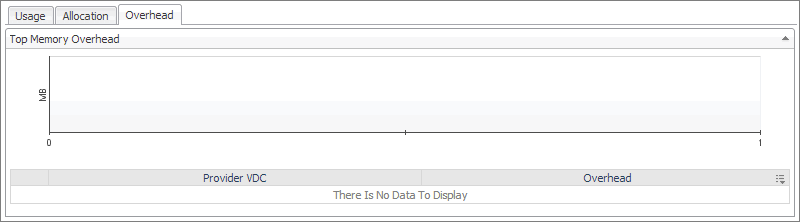
The amount of memory overhead generated by an organization, organization vDC, or provider vDC

VMVCloudOrganization memoryOverhead

VMVCloudOrganizationVDC memoryOverhead

VMVCloudProviderVDC memoryOverhead

Verwandte Dokumente

The document was helpful.

Bewertung auswählen

I easily found the information I needed.

Bewertung auswählen