Chat now with support
Chat mit Support

Foglight for VMware 5.8.2 - User and Reference Guide

Using Foglight for VMware
Introducing the virtual infrastructure Navigation basics Interacting with Foglight for VMware VMware Performance Agent configuration
Reference
Views
VMware Alarms views VMware Explorer views VMware Modeler views VMware VirtualCenter views VMware Environment views Other views
Rules
Agent Rules Cluster Rules Datacenter Rules Datastore Rules Resource Pool Rules ESX Server Rules VirtualCenter Rules Virtual Machine Rules VMW Stale Data Management Rule Virtual Switch Rules
Appendix: Alarm Messages Appendix: Metrics

Datacenters view

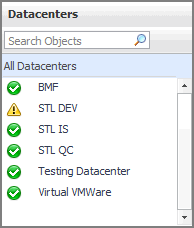
This tree view lists the datacenters that exist in your environment and shows their state.

Figure 95. Datacenters view

Selecting All Datacenters displays overall resource utilization for all datacenters in your integrated system, and the elements that consume the highest amount of system resources in the Summary - All Datacenters view on the right. Similarly, selecting a datacenter node shows datacenter-specific metrics in the Datacenter Summary view on the right.

On the VMware Environment dashboard, on the Monitoring tab, in the Virtual Environment Overview, select the Datacenters tile.
The Datacenters view appears in the Quick-View on the left.
Alarm severity. The state of the highest-severity alarm raised against the selected datacenter.
All Datacenters. A parent node for the datacenter object instances that appear in this view.
Datacenter. A datacenter name.

Drill down on:

Summary - Datastore view

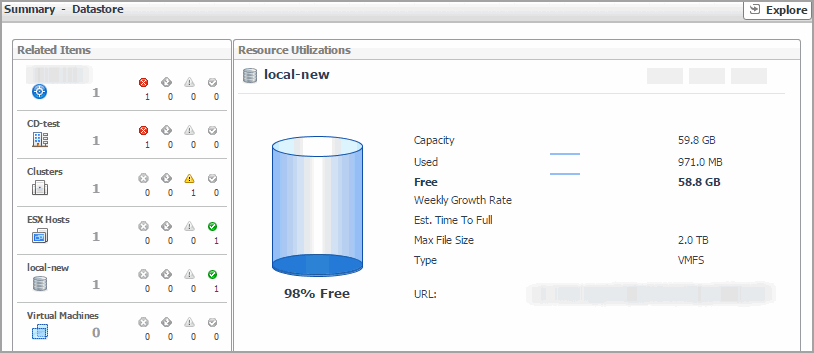
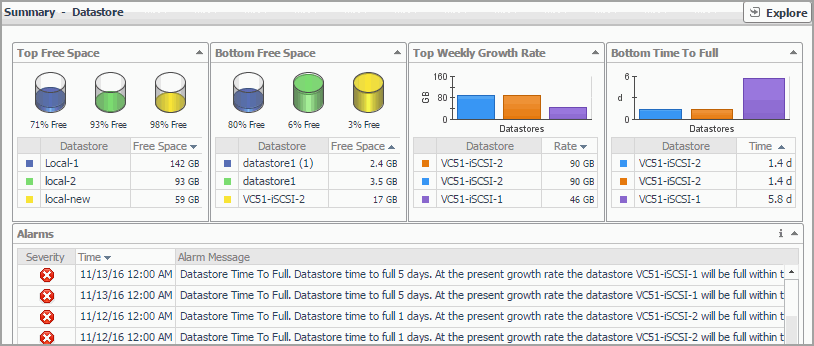
The Summary - Datastore view shows the overall resource utilization and the amounts of system resource consumption for a physical datastore.

1
On the VMware Environment dashboard, on the Monitoring tab, in the Virtual Environment Overview, select the Datastores tile.
2
In the Quick-View, select a datastore node in the Datastores view.
The Summary - Datastore view appears on the right.

This view is made up of the following embedded views:

Table 119. Alarms

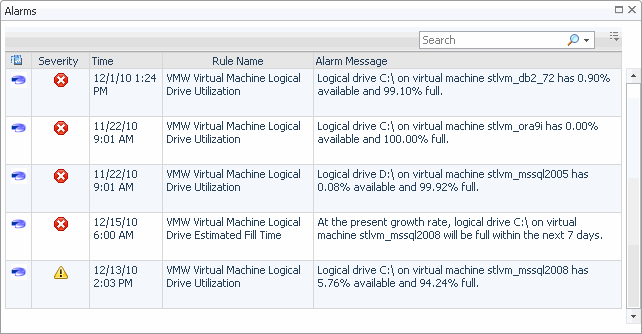
Lists the alarms generated against the selected datastore.

Alarm Message. An explanation about why the alarm occurred.
Severity. Indicates the alarm severity: Warning, Critical, or Fatal.
Time. The time when the alarm was generated.

Drill down on:

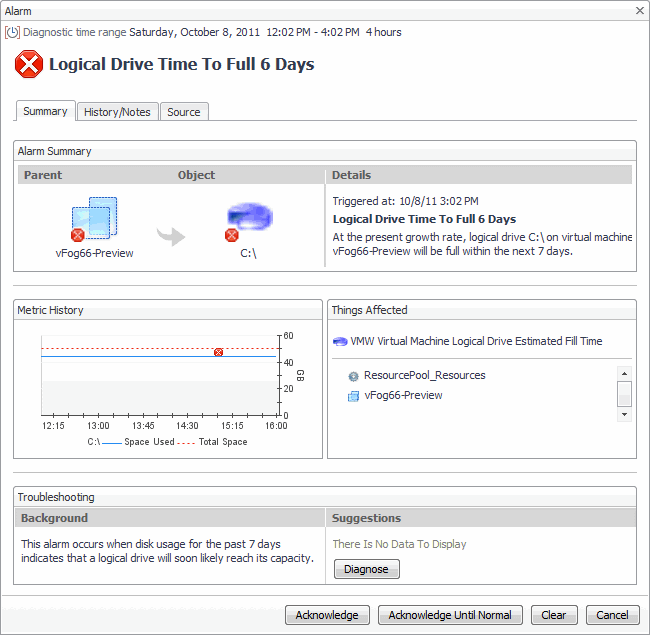
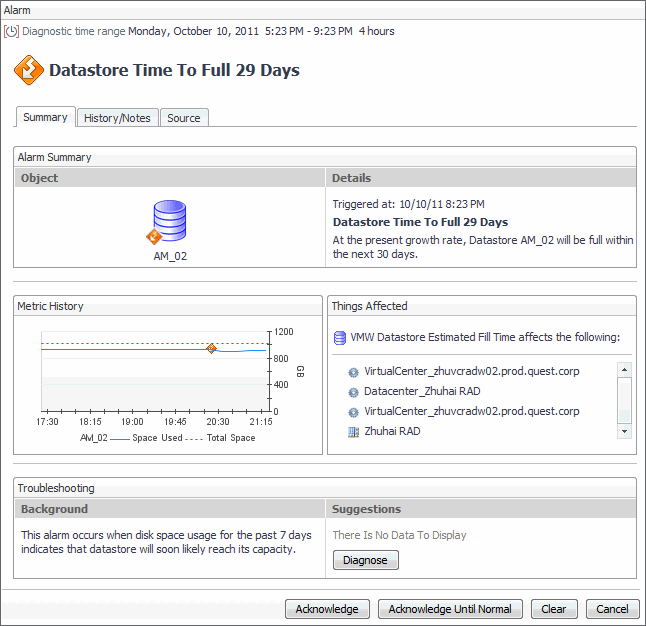
Alarm Message, Severity, or Time. Displays the Alarm dialog box, showing additional information about the alarm. For more information about alarms in Foglight, see the Foglight User Help.
Table 120. Related Items

Shows the numbers and states of the selected datastore and other components associated with this datastore.

Clusters. The number of clusters associated with the selected datastore, followed by the related alarm counts.
Datacenter. The name of the datacenter associated with the selected datastore, followed by the related alarm counts.
Datastore. The name of the selected datastore, followed by the related alarm counts.
ESX Hosts. The number of hosts associated with the selected datastore, followed by the related alarm counts.
Virtual Center. The name of the virtual center associated with the selected datastore, followed by the related alarm counts.
Virtual Machines. The number of virtual machines that are associated with the selected datastore, followed by the related alarm counts.

Drill down on:

Alarm count. Displays the Alarms dialog box that shows a list of all related alarms. For each alarm entry, it shows its severity, the time at which it was triggered, the rule name that triggered the alarm, and the alarm message.
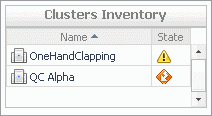
Clusters. Displays the Clusters Inventory dwell, showing the names and states of the clusters associated with the selected datastore.
Datacenter. Displays the Datacenters Inventory dwell, showing the name and state of the datacenter associated with the selected datastore.
Datastore. Displays the Datastores Inventory dwell, showing the name and state of the selected datastore.
Virtual Center. Displays the Virtual Centers Inventory dwell, showing the name and state of the virtual center associated with the selected datastore.
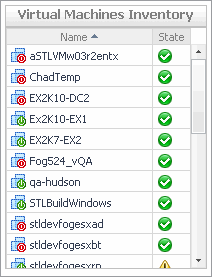
Virtual Machines. Displays the Virtual Machines Inventory dwell, showing the names and states of all virtual machines that are associated with the selected datastore.

Shows the resource consumption for the selected datastore broken down into four simple views.

Capacity. The total space allocated to this datastore.
Datastore. The name of the selected datastore, followed by the related alarm counts.
Est. Time Until Full. The estimated amount of time until which this datastore will become full.
Free. The amount of free space for this datastore.
Max File Size. The maximum file size for this datastore.
Percent Free. The percent of free space for this datastore.
Type. The datastore type.
URL. The datastore URL.
Used. The amount of used space for this datastore.
Weekly Growth Rate. The average amount of space the datastore expands every week.

Drill down on:

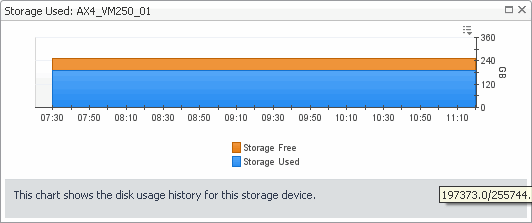
Free or Percent Free. Displays the Storage Used dialog box.
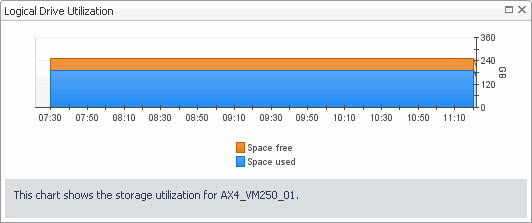
Used. Displays the Logical Drive Utilization dialog box.

Summary - Datastore view

The Summary - Datastores view displays overall resource utilization information for a group of physical datastores and shows the elements that consume the highest amount of system resources.

1
On the VMware Environment dashboard, on the Monitoring tab, in the Virtual Environment Overview, select the Datastores tile.
2
In the Quick-View, select the All Datastores node in the Datastores view.
The Summary - Datastore view appears on the right.

This view is made up of the following embedded views:

Table 122. Alarms

Lists the alarms generated against the monitored system.

Alarm Message. An explanation about why the alarm occurred.
Severity. Indicates the alarm severity: Warning, Critical, or Fatal.
Time. The time at which the alarm was generated.

Drill down on:

Severity. Displays the Alarm Created dialog box, showing additional information about the alarm. For more information about alarms in Foglight, see the Foglight User Help.

Shows the three datastores with the lowest amount of free space.

Datastore. The name of the datastore.
Free space.The amount of free space for this datastore.

Drill down on:

Shows the three datastores with the highest amount of time until they reach their full capacity, based on the current trend.

Datastore. The name of the datastore.
Time.The estimated amount of time after which this datastore becomes full.

Drill down on:

Table 125. Top Free Space

Shows the three datastores with the highest amount of free space.

Datastore. The name of the datastore.
Free space.The amount of free space for this datastore.

Drill down on:

Shows the three datastores with the highest weekly growth rate.

Datastore. The name of the datastore.
Rate.The average amount of space the datastore expands every week.

Drill down on:

Datastores view

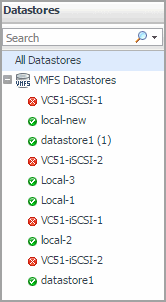
This view is a tree view. It lists the datastores that exist in your environment and shows their state.

Figure 98. Datastores view

Selecting the All Datastores node displays overall resource utilization for all datastores in your integrated system, and the elements that consume the highest amount of system resources in the Summary - Datastore view on the right. Similarly, selecting a datastore node shows datastore-specific metrics in the Summary- Datastore view on the right.

On the VMware Environment dashboard, on the Monitoring tab, in the Quick-View, select the Datastores tile.
The Datastores view appears in the Quick-View on the left.
Alarm severity. The state of the most recent alarm raised against the associated datastore.
All Datastores. A parent node for the datastore object instances that appear in this view.
Datastore classifications. The datastore classifications, which include the following options: vSan Datastores, VMFS Datastores, NFS Datastores, and VVOL Datastore. Clicking a classification node shows all available datastores that belong to this classification.

Drill down on:

Verwandte Dokumente

The document was helpful.

Bewertung auswählen

I easily found the information I needed.

Bewertung auswählen