Hyper-V Explorer Topology tab
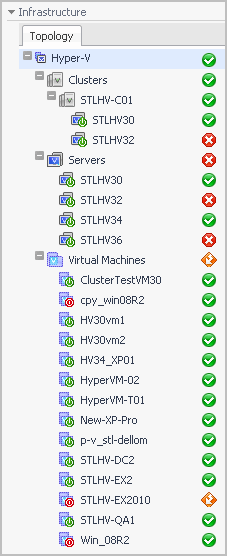
The Hyper-V Explorer Topology tab contains an organized view of the virtual infrastructure objects that are monitored by Foglight for Hyper-V: clusters, servers, and virtual machines.
This tab appears on the navigation panel, under Infrastructure.
Hyper-V Explorer Summary
Hyper-V Explorer Summary tab
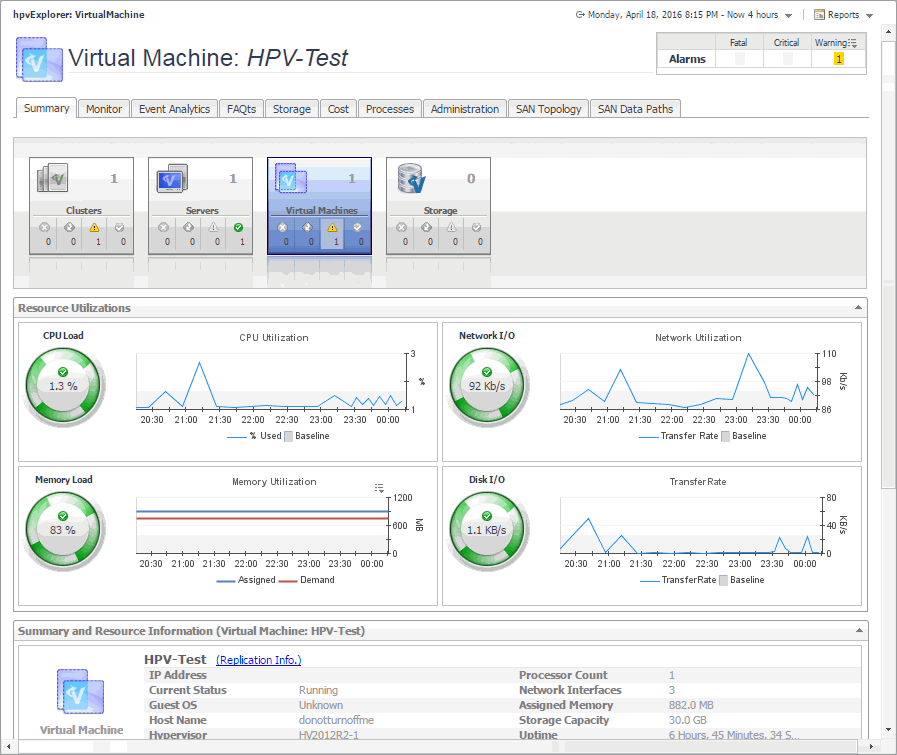
The Hyper-V Explorer Summary tab shows a summary of system resources for a selected cluster, server, or virtual machine.
This tab appears in the Hyper-V Explorer when you select a cluster, server, or virtual machine instance on the Hyper-V Explorer Topology tab.
This tab is made up of the following embedded views:
|
• |
|
• |
| |||
| |||
| |||
| |||
| |||
| |||
| |||
| |||
| |||
| |||
| |||
| |||
| |||
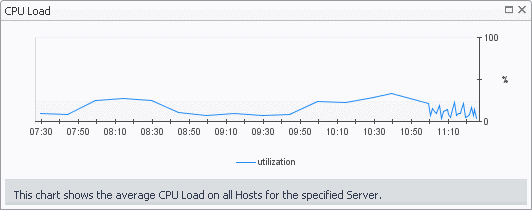
Figure 156. CPU Load dialog box
| |||
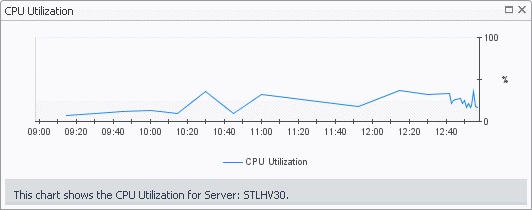
Figure 157. CPU Utilization dialog box
| |||
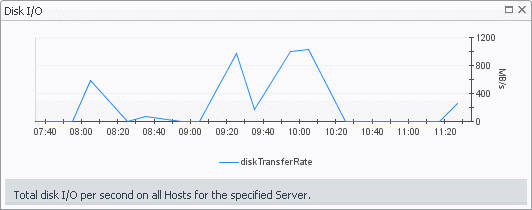
Figure 158. Disk I/O dialog box
| |||
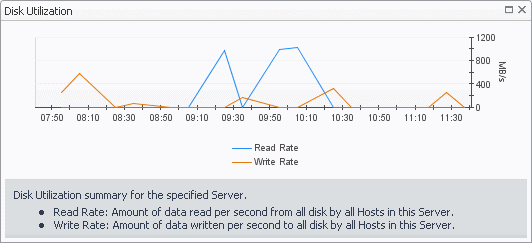
Figure 159. Disk Utilization dialog box
| |||
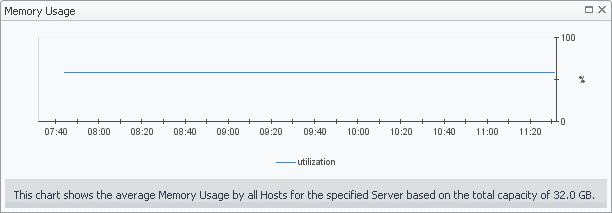
Figure 160. Memory Usage dialog box
| |||
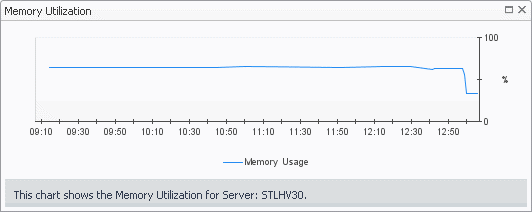
Figure 161. Memory Utilization dialog box
| |||
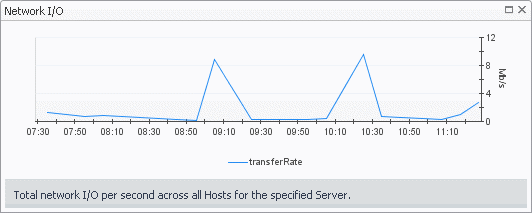
Figure 162. Network I/O dialog box
| |||
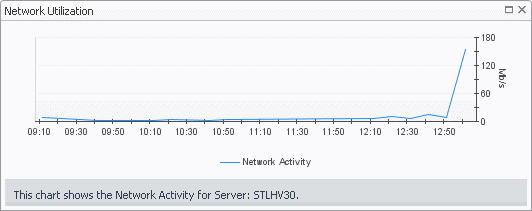
Figure 163. Network Utilization dialog box
|
|
Shows a list of servers that belong to the selected cluster. | |||
| |||
| |||
| |||
| |||
| |||
| |||
| |||
| |||
|
Drill down on any server entry. The Hyper-V Explorer dashboard appears, showing the server details on the Hyper-V Explorer Summary tab. |
|
Shows physical configuration details for the selected cluster, server or virtual machine. | |||
| |||
| |||
| |||
| |||
| |||
| |||
| |||
| |||
| |||
| |||
| |||
| |||
| |||
| |||
| |||
| |||
| |||
| |||
| |||
| |||
| |||
| |||
| |||
| |||
| |||
| |||
| |||
| |||
| |||
| |||
|
|
The Hyper-V Explorer’s Virtual Environment view displays a high-level overview of your virtual environment. The view has a tile for each object type: Clusters, Servers, and Virtual Machines. Each tile shows how many of the corresponding object instances there are in your virtual infrastructure, as well as the count of objects of that type in each of the alarm states (Normal, Warning, Critical, Fatal). | |||
| |||
| |||
| |||
| |||
Figure 164. Clusters dwell
| |||
Figure 165. Clusters dwell
| |||
Figure 166. Virtual Machines dwell
|
|
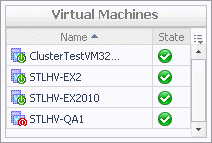
Shows a list of virtual machines associated with the selected cluster or server. | |||
| |||
| |||
|
Drill down on any virtual machine entry. The Hyper-V Explorer dashboard appears, showing the virtual machine details on the Hyper-V Explorer Summary tab. |
Hyper-V Explorer Summary (All Clusters) tab
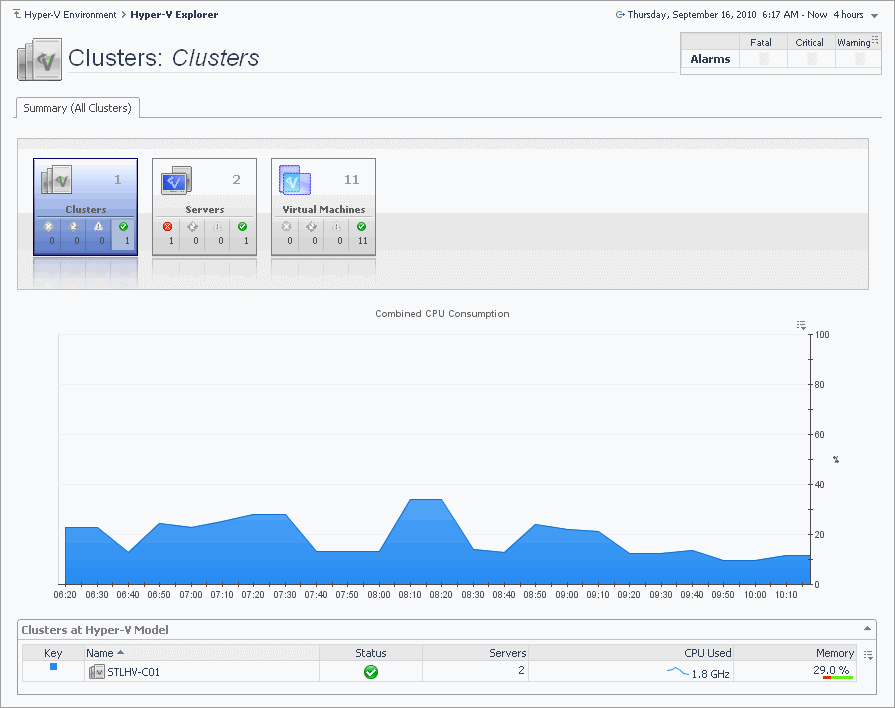
The Hyper-V Explorer Summary (All Clusters) tab shows a summary of system resources for all available clusters.
This tab appears in the Hyper-V Explorer when you select the Clusters node on the Hyper-V Explorer Topology tab.
This tab is made up of the following embedded views:
|
This tabular view lists the clusters that exist in your environment. | |||
| |||
| |||
| |||
| |||
| |||
| |||
|
Drill down on any server entry. The Hyper-V Environment dashboard appears, showing the server details on the Hyper-V Explorer Summary tab. |
|
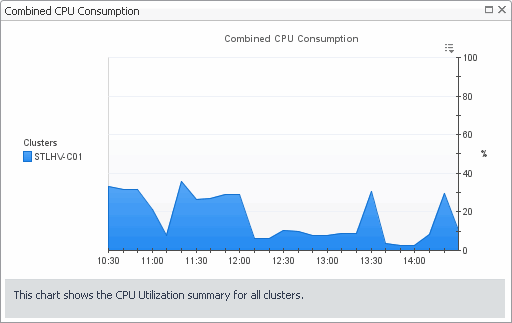
Shows the combined percentage of the CPU usage for all clusters in the system. | |||
| |||
Figure 168. Combined CPU Consumption dialog box
|
|
Displays a high-level overview of your virtual environment. The view has a tile for each type of object in your virtual infrastructure: Clusters, Servers, and Virtual Machines. Each tile shows how many of the corresponding object instances there are in your virtual infrastructure, as well as the count of objects of that type in each of the alarm states (Normal, Warning, Critical, Fatal). | |||
| |||
| |||
| |||
| |||
Figure 169. Clusters dwell
| |||
Figure 170. Servers dwell
| |||
Figure 171. Virtual Machines dwell
|

