Chat now with support
Chat mit Support

Foglight for VMware 5.8 - User and Reference Guide

Using Foglight for VMware
Introducing the virtual infrastructure Navigation basics Interacting with Foglight for VMware VMware Performance Agent configuration
Reference
Views
VMware Alarms views VMware Explorer views VMware Modeler views VMware VirtualCenter views VMware Environment views Other views
Rules
Agent Rules Cluster Rules Datacenter Rules Datastore Rules Resource Pool Rules ESX Server Rules VirtualCenter Rules Virtual Machine Rules VMW Stale Data Management Rule Virtual Switch Rules
Appendix: Alarm Messages Appendix: Metrics

Network tab

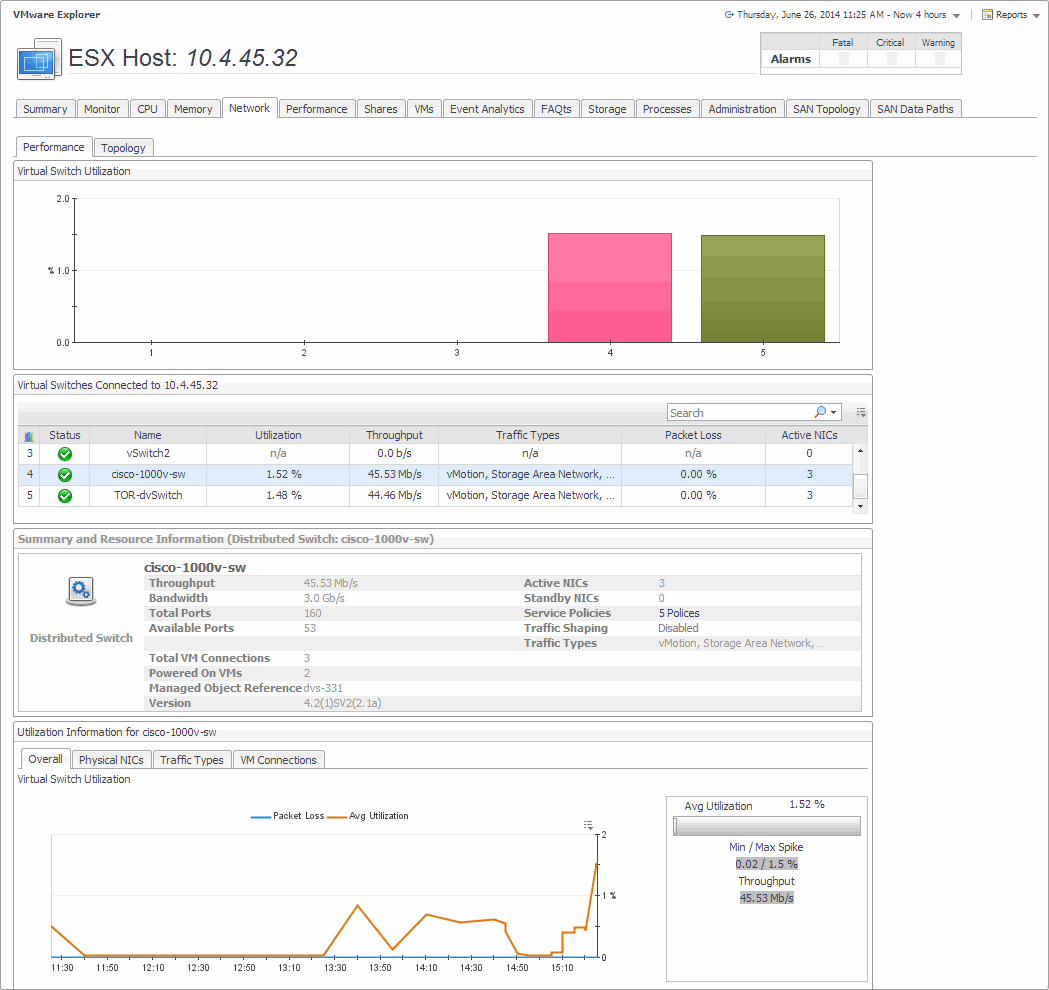
This tab displays the utilization of the virtual switches associated with the selected ESX hosts.

Figure 68. Network tab

2
On the Virtual Infrastructure view, that appears on the navigation panel, select a ESX host.

This tab is made up of the following embedded views:

For each virtual switch associated with the selected ESX host (and listed in Performance tab, Virtual Switches Connected to ESX Host), it displays the percentage of the network resources available to the switch that are in use.

Identifies the virtual switches associated with the selected ESX host.

Name. The name of the virtual switch.
Utilization. The current percentage of the network resources available to the virtual switch that are in use.
Throughput. The rate of network traffic processed by the virtual switch.
Traffic Types. Identifies the data traffic types that are processed by the virtual switch.
Packet Loss. The average percentage of time the data packets sent to the virtual switch are not echoed back.
Active NICs. The number of active network interface cards that the virtual switch uses.

Shows detailed configuration information about the selected virtual switch.

Throughput. The rate of network traffic processed by the virtual switch.
Bandwidth. The amount of network bandwidth available to the switch.
Total Ports. The total number of ports on the virtual switch.
Available Ports. The number of available ports on the virtual switch.
Total VM Connections. The total number of virtual machines connected to the ESX host through the virtual switch.
Powered On VMs. The total number of virtual machines connected to the ESX host through the virtual switch that are currently powered on.
Managed Object Reference. Identifies the virtual switch in your monitored environment.
Version. The version number of the distributed switch component in your virtual environment.
Active NICs. The number of active network interface cards that the virtual switch uses.
Standby NICs. The number of network interface cards that the virtual switch uses, that are currently in standby mode.
Network I/O Control (standard or distributed virtual switches only). Indicates if the selected switch can use network resource pools to prioritize network traffic.
Service Policies (Cisco virtual switches only). Shows the number of service policies in use.
Traffic Shaping. Indicates if the traffic shaping policy is enabled or disabled on the selected switch. A traffic shaping policy can restrict the network bandwidth to a port or if a port is configured to temporarily allow transmission of data at higher than normal speeds. For more information about these policies, see your VMware documentation.
Traffic Types. Identifies the data traffic types that are processed by the virtual switch.

Drill down on:

Network I/O Control (standard or distributed virtual switch only). Displays a dwell showing a list of network pools the virtual switch uses and the related information.

Traffic Shaping. Displays a dwell showing a list of port groups associated with the virtual switch and the related information.

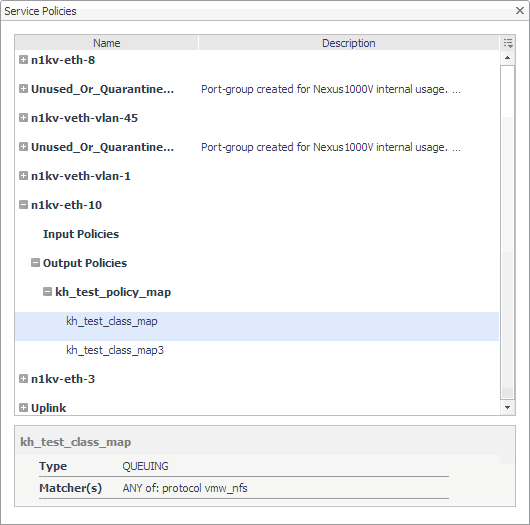
Service Policies (Cisco virtual switches only). Displays the Service Policies dialog box showing a navigation tree with port groups and the policies associated with each group. Navigate the tree and click a network policy to find out more information about it.

Displays detailed utilization information for the virtual switch selected in the Performance tab, Virtual Switches Connected to ESX Host view.

Overall tab, Virtual Switch Utilization chart. Displays the overall switch efficiency. The Packet Loss line in the chart represents the average percentage of time the data packets sent to the monitored switch are not echoed back over the selected time period. The Avg Utilization line in the chart represents the average percentage of the network resources available to the switch that are in use over the selected time period. The Avg Utilization percentage indicates the average percentage of the network resources available to the switch that are currently in use. Min / Max Spikes shows the difference between the lowest and highest percentage of the average utilization. Throughput is the rate of network traffic processed by the virtual switch.
Physical NICs tab, Physical Adapter Utilization chart. Displays the overall utilization of each network interface card used by the virtual switch.
Physical NICs tab, Physical Adapter Distribution chart. Displays the overall workload distribution for each network interface card used by the virtual switch. High/Low Utilization shows the difference between the lowest and highest percentage of the average utilization. Variance is the difference between the lowest and highest average network adapter utilization
Traffic Types tab, Traffic Type Utilization chart. Illustrates how different types of data traffic are represented in the overall network traffic managed by the selected switch. The current percentages of different type of network traffic appear in the table, while the chart displays the values captured over the selected time period.
VM Connections tab, Virtual Machine Connections chart. For each virtual machine associated with the selected virtual switch, it displays its average inbound and outbound data transfer rates over the selected time period.
Table 46. Topology tab

Visualize the relationships between the objects in your environment through an interactive map. The map illustrates how different components relate to each other, and the levels of the available resources available to them. For more information about the topology map appearing on this tab, see Standard vSwitch Topology and Distributed vSwitch Topology views

Performance tab

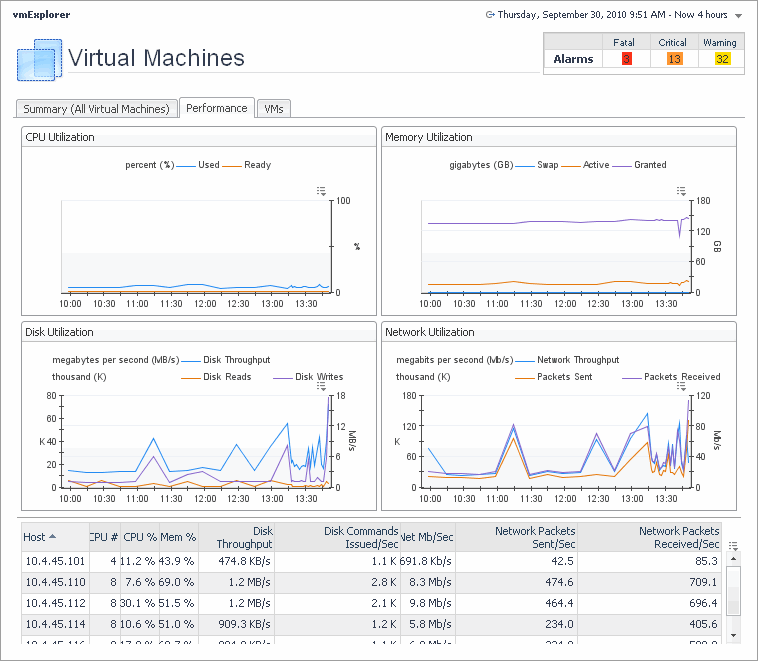
This tab displays the resource utilization for the selected object or group of objects over a selected period of time.

Figure 69. Performance tab

2
On the Virtual Infrastructure view, that appears on the navigation panel, select a Virtual Center, datacenter, cluster, ESX host, resource pool, or one of the following containers: Datacenters, ESX Hosts, Resource Pools, or Virtual Machines.

This tab is made up of the following embedded views:

Table 47. CPU Utilization

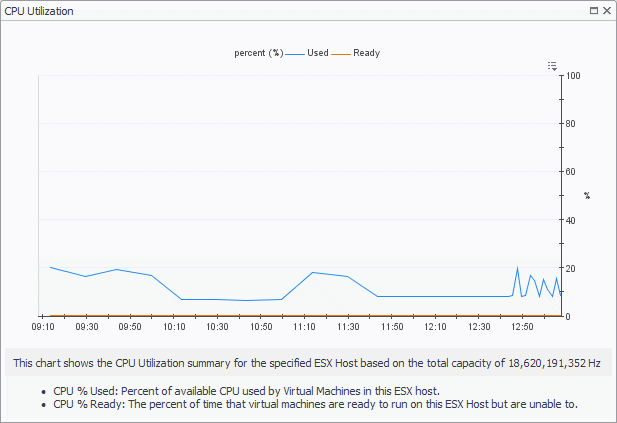
Shows the CPU utilization summary for the selected component based on its total capacity during a selected time period.

Ready. The percentage of time the CPU is ready but is not used.
Used. The percentage of available CPU processing that is currently in use.
Drill down on the CPU Utilization graph. Displays the graph along with some additional information.

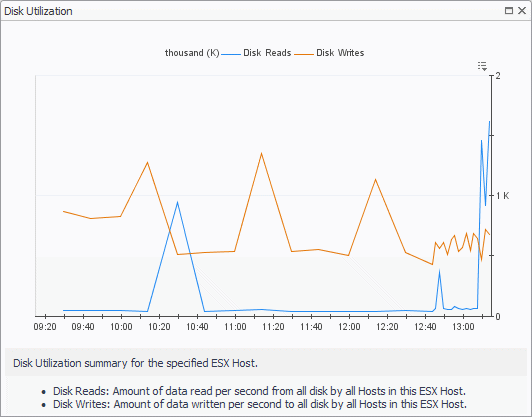
Shows the disk utilization summary for the selected component during a selected time period.

Disk Reads. The amount of data read from disk.
Disk Writes. The amount of data written to disk.
Drill down on the Disk Utilization graph. Displays the graph along with some additional information.
Table 48. Hosts

View shows a list of all ESX hosts associated with the selected component. For each host, it shows its name, the number of CPUs, the current percentages of CPU and memory use, disk throughput rate, rate at which disk commands are issued, and the rate at which data packets are sent to and received from the network.

CPU #. The number of CPUs associated with the host.
CPU %. The current CPU utilization for the selected host.
Disk Commands Issued/Sec. The rate of disk commands issued for the selected host.
Disk Throughput. The disk throughput rate for the selected host.
Host. The host’s IP address.
Mem %. The current memory utilization for the selected host.
Net Mb/Sec. The current rate of network throughput for the selected host.
Network Packets Sent/Sec. The rate of network packets sent to the network.
Network Packets Received/Sec. The rate of network packets received from the network.
Drill down on the Disk Utilization graph. Displays the graph along with some additional information.

Shows the physical memory utilization summary for the selected component, broken into the amounts of memory that is swapped to disk, actively used, and allocated, all during a selected time period.

Active. The amount memory that is actively used.
Granted. The amount memory that is allocated to the selected component.
Swapped. The amount memory that is swapped to disk.
Drill down on the CPU Utilization graph. Displays the graph along with some additional information.

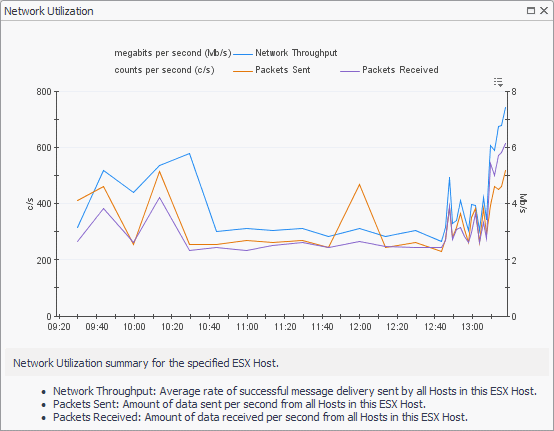
Shows the network utilization summary for the selected component, including the average rate of network throughput, and the amounts of data sent to and received from the network

Network Throughput. The average rate of network throughput.
Packets Received. The amount of data received from the network.
Packets Sent. The amount of data sent to the network.
Drill down on the Network Utilization graph. Displays the graph along with some additional information.

Processes tab

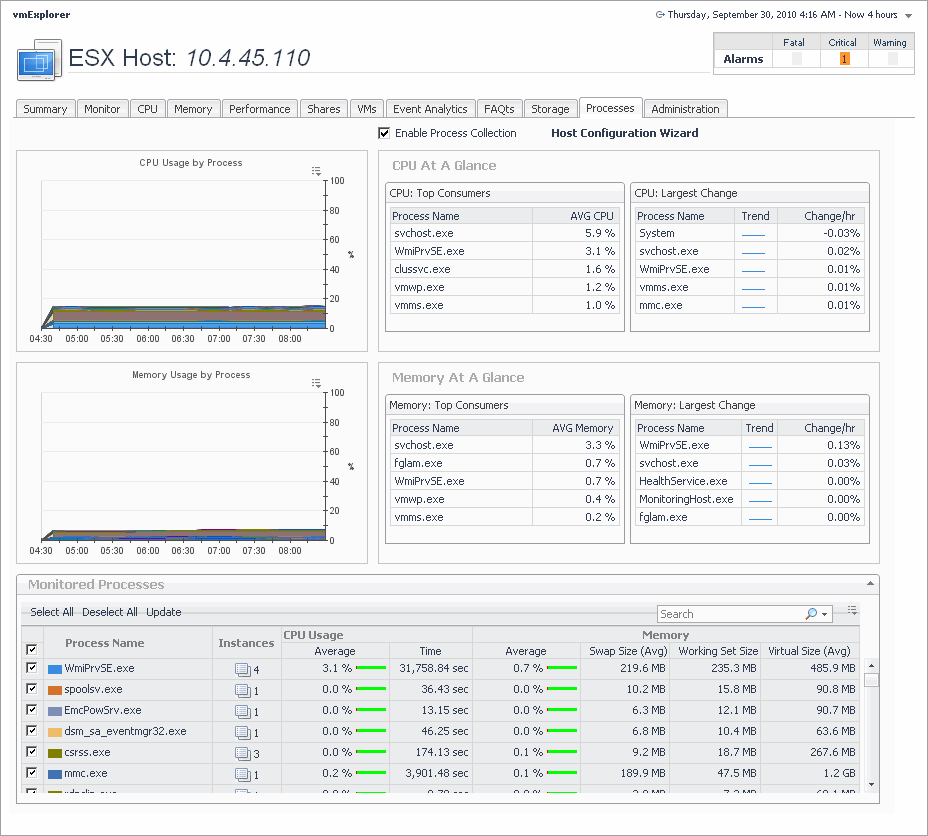
This tab only appears when you are exploring individual Virtual Centers, ESX hosts, and virtual machines, and have Foglight for Guest Processes Investigation installed and active. It displays an organized view of process information gathered by Foglight for Guest Process Investigation from the virtual or physical machine configured to send process information. When you open this tab, the process information for the selected server or virtual machine appears, allowing you to view the current CPU, memory, and monitored process statistics.

Figure 70. Processes tab

2
On the Virtual Infrastructure view, that appears on the navigation panel, select a Virtual Center, ESX host, or virtual machine instance.

This tab is made up of several embedded views. For complete information about these views, see the Investigating Guest Processes User and Reference Guide.

Related Objects views

At least one Related Objects view is provided in the VMware Explorer dashboard.

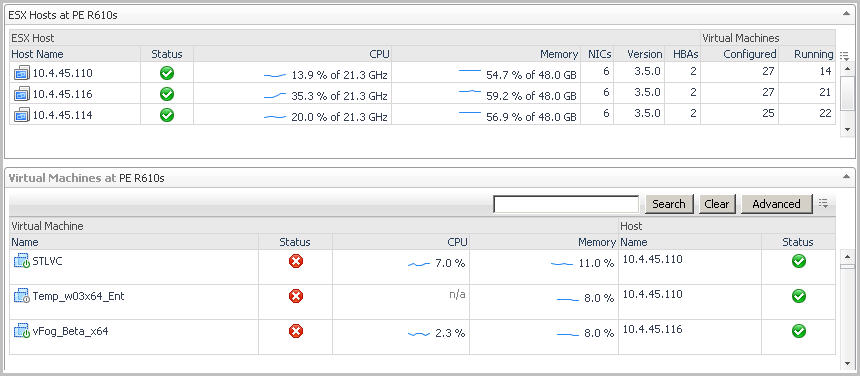
Related Objects views are part of the VMware Explorer Primary view and are typically located at the bottom of the Primary view. More than one Related Objects view may appear at a time.

Related Objects views provide summary information on either the parent or child objects or both (whichever is applicable) of the object being viewed in the dashboard.

Related Objects views differ from each other and may not appear at all depending on the object or collection of objects selected from the Virtual Infrastructure view and on the navigation tab selected from the VMware Explorer Primary view heading.

Related Objects views for an individual object display tables that list either the parents or children or both (whichever is applicable) of the selected object, and provide pertinent summary details about each one. The Related Objects view for a collection of objects displays a table that lists all of the objects in the selected collection and provides pertinent summary details about each one. You can sort Related Objects view tables by a particular column by clicking the corresponding column heading. If you select an object from the table by clicking on one of the table rows, all of the views in the VMware Explorer dashboard get updated with information about that object.

Verwandte Dokumente

The document was helpful.

Bewertung auswählen

I easily found the information I needed.

Bewertung auswählen