For a single farm, Web application, or site collection, you can analyze trends over a specified time period in:
·activity
·site count, and/or
·storage.
To generate a Trends analysis:
1Select the object for which you want to analyze trends.
NOTE: You can only analyze trends for one site collection at a time. If you multi-select, only the object on which you right-clicked will apply.
2Use the information in the following table to determine the appropriate action to take.
|
If you want to analyze trends in ... |
Choose ... |
|---|---|
|
activity |
Activity > Trend Analysis for Activity. |
|
site count |
Content > Trend Analysis for Site Count. |
|
storage |
Storage > Trend Analysis for Storage. |
3Specify the following parameters for your analysis:
a)Enter or select a Start Date and End Date for your analysis.
The date range you select determines the time intervals captured in the analysis, as described in the following table.
|
If the time period you specified is ... |
Then the Trend Analysis will be reported ... |
|---|---|
|
up to 60 days |
by Day |
|
between 61 and 364 days |
by Week |
|
365 days or greater |
by Month. |
b)If you want to change the Statistics to Graph, select a different value from the drop-down.
c)If you want your graph to include a line that smooths out short-term fluctuations, check the Include moving Average box.
The default value for Moving average period (days) is 7, which represents the number of days within a given week. This value is useful for many business users who can expect less activity, for example, on the weekend. You can, however, change this value to measure moving average for a different time period. For example, if you generally experience week-to-week fluctuations over the course of a month, you may choose to set the Moving average period to 31.
Now you can:
·run the operation immediately (by clicking the [Run Now] button)
OR
·schedule the operation to run at a later time or on a recurring basis.
OR
·save the operation as XML Instructions that can be run at a later time.
Trend Analysis results consist of two graphs:
·The Trend Analysis bar graph includes the statistics for the selected criterion. (Note that if you selected ALL from the Statistics to graph drop-down, a separate graph will be included for each). Below are examples of Trend Analyses by Day reports (including a 7-day moving average) for Activity, Storage, and Site Count over the same 28-day time period.
Activity Trend Analysis
Storage Trend Analysis
Site Count Trend Analysis
·The second graph is a line graph that shows statistics for all three options (activity, storage, and site count) in terms of a percentage over the course of the selected time period. Note that the maximum value (100%) represents the most storage used, greatest level of activity, and largest site count over the selected time period.
ControlPoint provides the following tools for analyzing site content:
·The Metadata Usage analysis shows where and how Managed Metadata is used in SharePoint Server farms
·The Content Types analysis shows properties and usage details of SharePoint content types.
·The Web Parts analysis include detailed statistics about Web Parts used in selected sites.
You can also analyze trends in site count over a specified time period.
The Metadata Usage analysis lets you analyze the use of managed metadata as list/library columns in your SharePoint environment. You can group results by site or by term set and you have the option to Include usage count and the individual items in lists or libraries that use the metadata.
To generate a Managed Metadata Usage analysis:
1Select the object(s) whose managed metadata usage you want to analyze.
2Choose Content > Managed Metadata Usage.
3Specify the parameters for your analysis. Use the information in the following table for guidance.
|
If you ... |
Then ... |
|---|---|
|
want results to include only metadata with term sets OR terms that contain a specific text string
|
·enter the string in Show only Metadata of TermSets/Terms containing field. NOTE: You can enter multiple text strings as a comma-separated list. ·choose the applicable Select by option (to indicate whether you want ControlPoint to search for TermSet or Term) |
|
want results to include the number of list items that have a value in the column that uses the metadata |
check the Show item usage count box. |
|
want results to include the actual list items that have a value in the column that uses the metadata |
check the Show items in list or library box. NOTE: If you check this box, ControlPoint must iterate through all list items. Depending on the scope of your analysis and the number of items within that scope, processing time may increase noticeably. |
|
want to group results by term set rather than by site |
uncheck the Group by Site box. |
Now you can:
·run the operation immediately (by clicking the [Run Now] button)
OR
·schedule the operation to run at a later time or on a recurring basis.
OR
·save the operation as XML Instructions that can be run at a later time.
If you chose to group results by site:
·The top level of the analysis shows each of the Web applications and sites within the scope of your analysis that use managed metadata
·When expanded, the following information displays each list that uses managed metadata, along with the following information:
§the name of the Column referencing the Metadata
§the Term Store, Term Group, and Term Set
§the Term specified for the list column (if applicable)
NOTE: The Term column will also show item-level terms only if the Show items in list or library box.
§if the Item Usage count parameter was checked, the number of items for which the column has been populated with metadata.
If you chose to group results by TermSet:
·The top level of the analysis shows each Term Store providing the metadata, followed by each Term Group and Term Set.
·When expanded, the following information displays for each term set:
§the site that uses the metadata
§for each list that uses the metadata:
§the name of the Column Referencing the Metadata
§if the Item Usage count parameter was checked, the number of items for which the column has been populated with metadata.
§the Term specified for the column (if applicable)
NOTE: The Term column will also show item-level terms only if the Show items in list or library box.
Note that if you have customized a term set for the site collection, SharePoint assigns the name of the Term Group.
To open the SharePoint site that uses the metadata, click on the site url.
To open SharePoint list settings page for a list, click on the list name.
The Content Type Analysis provides information about SharePoint content types within a selected scope, including
·the content type's parent object
·the site or list where the content type was defined.
You can specify additional parameters to include more detail (such as a count of items that use the content type and/or a list of the items themselves), and you can choose to group results by either content type or site.
Note About "Common" Content Types
A list of "common content types" is maintained in the file CommonContentTypes.xml, which is located on the Web front-end server where ControlPoint is installed, in the following SharePoint hive subdirectory: \TEMPLATE\LAYOUTS\Axceler\App_Data.
By default, this list includes default content types associated with SharePoint built-in templates. The purpose of this list is to give you the option to "filter out" commonly used content types from analysis results.
You can customize this file to include "common" content types specific to your environment that you would like to have the option of excluding. For example, you may want to filter out a company-specific content type that is used in every site in your farm. You may also want to remove a default content type from the list.
Changes that you make to this file must be copied to any additional Web front-end servers in your farm. Also, whenever you install a ControlPoint update or patch, this file is overwritten with a file containing the default list. Therefore, if you choose to make modifications, it is recommended that you keep a backup of the file in a different location so that you can replace the default version after an update or patch.
To generate a Content Type Analysis:
1Select the object(s) whose content types you want to analyze.
2Choose Change Management > Content Types.
3Specify the parameters for your analysis:
a)For Include sites where content types are, select one of the values described in the following table.
|
If you want results to include sites ... |
Select .... |
|---|---|
|
for which the content types are available, regardless of whether they have been "adopted" by a list/library |
Available. |
|
where the content types are defined, regardless of whether they have been "adopted" by a list/library |
Defined. |
|
containing lists/libraries that have "adopted" the content types |
In Use. NOTE: A content type that has been adopted by a list or library is considered "in use" regardless of whether it has actually been associated with any items. |
|
for which the content types: ·are available, and ·have not been adopted by a list/library |
Available, Not In Use. |
|
where the content types: ·are defined, and ·have not been adopted by a list/library. |
Defined, Not in Use. |
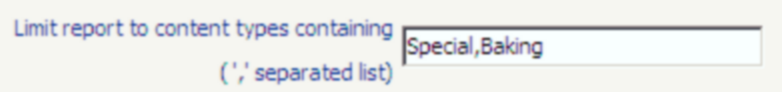
If you want to limit results to content types that contain a specific text string, enter that string in the Limit report to content types containing field. (You can enter multiple text strings as a comma-separated list).
b)Specify the remaining checkbox criteria using the guidelines in the following table.
|
If you ... |
Then ... |
|---|---|
|
want to group results by content type rather than by site |
uncheck the Group results by site box. |
|
want results to include the names of content type columns |
check the Show content type column names box. |
|
want results to include a count of the number of items with which the content type is associated |
check the Show item usage count box. NOTE: If you check this box, ControlPoint must iterate through all list items. Depending on the scope of your analysis and the number of items within that scope, processing time may increase noticeably. |
|
want to exclude common content types from results (see "About Common Content Types," above) |
check the Exclude common content types box. |
|
want results to include the lists and libraries that use the content type |
check the Show items in list or library box. NOTE: If you check this box, ControlPoint must iterate through all list items. Depending on the scope of your analysis and the number of items within that scope, processing time may increase noticeably. |
Now you can:
·run the operation immediately (by clicking the [Run Now] button)
OR
·schedule the operation to run at a later time or on a recurring basis.
OR
·save the operation as XML Instructions that can be run at a later time.
The analysis results header includes all of the parameters that you specified.
The top levels of the analysis shows either:
·all of the sites within the scope or your analysis, followed by the content types that are used within each site (if you chose to group results by site)
OR
·each of the content types within the scope of your analysis, followed by the sites that use it (if you chose to group results by content type).
When results are expanded, the following information displays for each content type:
·the name of the Content Type
·the content types Parent object (that is, the content type from which the content type was created)
·the content type's Source (that is, the site or list where the content type was defined)
·each of the Lists/libraries
·if selected in the Parameters section:
§the item Count (that is, the number of items within each list or library using that content type )
§the content type's Column Names
§a list of the Items that use the content type.
NOTE: If you chose Show item usage count and/or Show items in list or library, an Item Count will be included. If you chose neither of these parameters, the Item Count column header will not be visible.